Octave is a free alternative to Matlab. It processes numerical computation and offers built-in plotting and visualization tools to evaluate the behavior of formulas and powerful equations. Octave is a multi-platform tool that also contains many scripts compatible with Matlab. These features make it useful to students, teachers and researchers, who can demonstrate and make interpretations of their calculations graphically. This article shows basic usage of Octave, using an example graph of two trigonometric functions in one figure.
Installing and starting Octave
On Fedora Workstation, open the Software tool and type octave to find the application. Or you can use a terminal. Type octave and if it’s not installed, a message appears to ask you if it’s OK to install.
To check what version of Octave you have installed, read the command window. You can also open a terminal any time, and run this command:
octave --version
Due to an unaddressed bug in Octave, modern Linux systems using Wayland, like Fedora, may not show you graphs. To deal with this, first set Octave to use a different toolkit for graphing. Open a terminal and type this command:
echo 'graphics_toolkit ("gnuplot")' >> ~/.octaverc
This writes a one-line startup file telling Octave to start with a safe toolkit each time it runs.
If you’re using an Xorg session, you may not have to run the above command. The figure windows on your screen may vary depending on whether you’re running Wayland or Xorg.
Graphing a simple trigonometric function
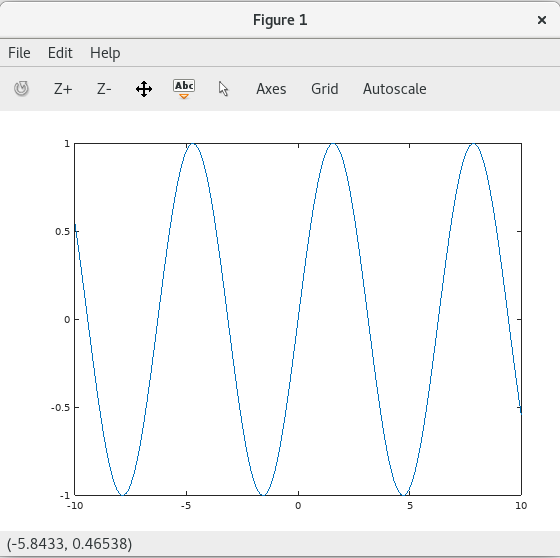
To graph the basic sine function, type the following in the command window:
x = -10:0.1:10;
plot (x, sin (x));
Press Enter and a figure of the sine function appears with the range and parameters previously defined (-10,10). Try fine tuning the graphic by changing the 0.1 parameter.
Adding axis and text labels
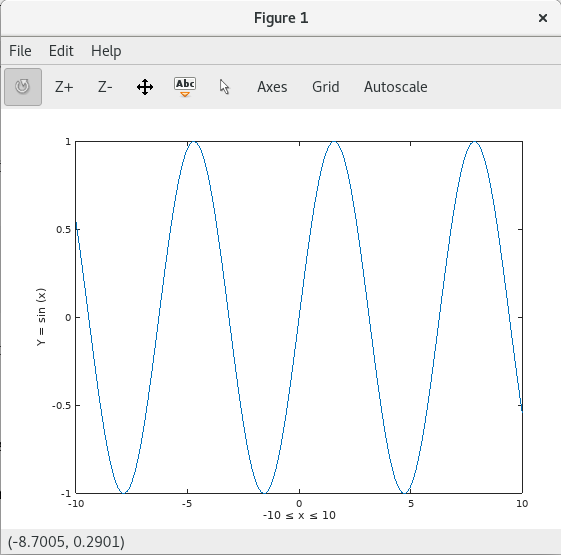
Axes in the graph help explain its content. So, next set the labels of both axes by defining the range of X and the value of Y:
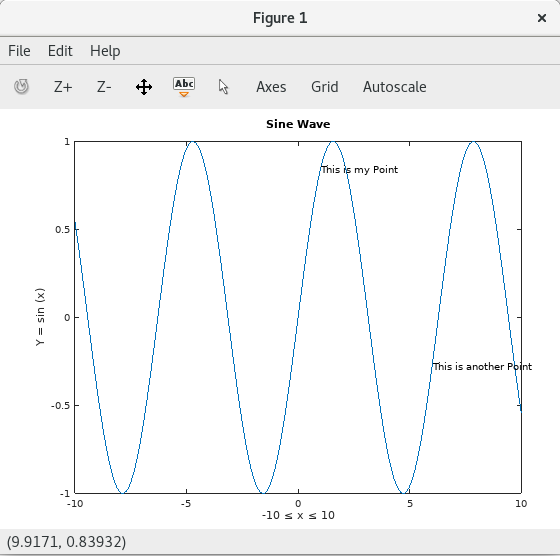
xlabel ("-10 ≤ x ≤ 10");
ylabel ("Y = sin (x)");
Afterward, click on the Refresh button to update the graphic of the sine formula:
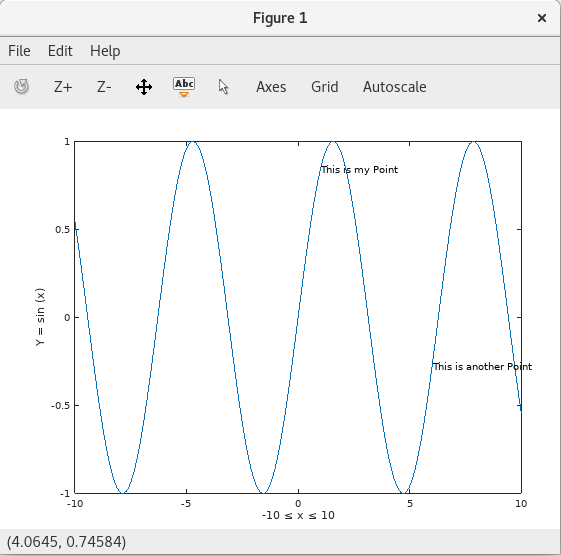
In addition, you might want to draw the viewer’s attention to specific points on the graph. The commands below label points at specific x and y coordinates:
text(1,sin(1),'This is my Point')
text(6,sin(6),'This is another Point')
Finally, add a title on this graphic with the title function:
title('Sine Wave')
Adding a second function
Start by creating a new figure.
figure
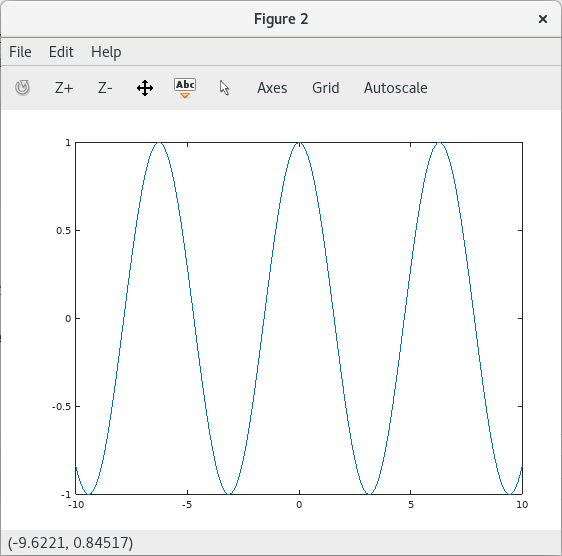
Now use cos to plot a graph of the trigonometric cosine function:
z = cos(x);
plot(x,z);
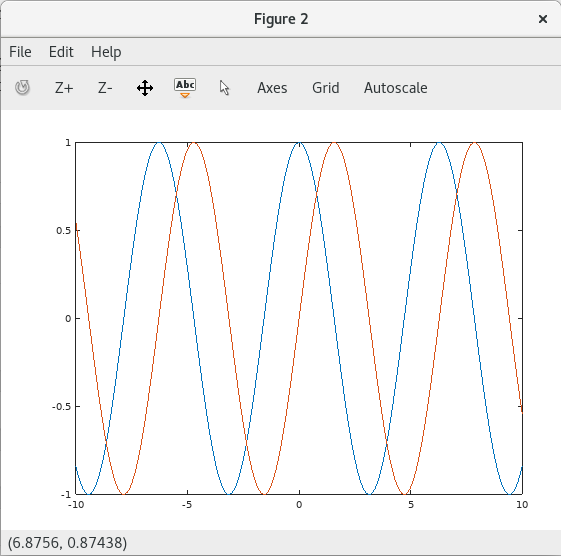
You can join the function with the previous one, in order to present them together. To illustrate this, use the hold on command and then plot the sine function as you did previously:
hold on
plot(x,sin(x));
Additional formatting
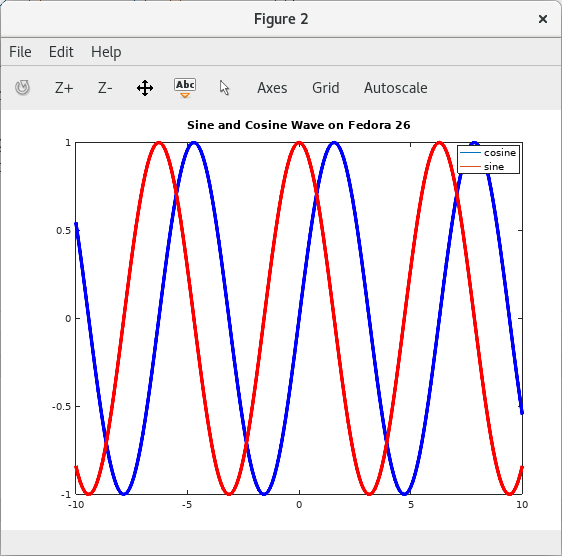
Colors allow readers to more easily follow the visual path of a line. Changing the width and adding a legend can help present the work for publication. For example, run the following commands to better format the graph:
plot (x,sin(x),'b', 'LineWidth',4);
plot (x,z,'r', 'LineWidth',4);
legend('cosine','sine')
title('Sine and Cosine Wave on Fedora 26')
Final thoughts
Octave also lets you define math elements as matrices, equations, or vectors, and you can use other values and equations to plot them. You can plot graphics in a 2D or 3D dimensional space. These and other powerful features make Octave a free alternative that can successfully support the work of students, educators, and other professionals.



Steve
Does it work with 4DIAC?
Bill Chatfield
Nice intro. Thanks!
Mehdi
Thank you. I really like this tool. Does it provide professional tools dedicated to certain fields like AI, Image Processing, Signal Processing, etc. as in MATLAB?
Christian Sudbrock
I’m still pretty new to Octave myself (Using it primarily to get my MATLab homework done for my Engineering Graphics class) so I’m not entirely sure of the answer myself, but I can tell you that there are addition packages for more specific uses at:
https://octave.sourceforge.io/
Hopefully this helps!
wk3
Thanks!
wio
Thanks for the information on bug fix.
avlas
Better use ‘>>’ instead of ‘>’ as this file may exist and have some other content:
echo ‘graphics_toolkit (“gnuplot”)’ >> ~/.octaverc
Paul W. Frields
@avlas: Good catch, fixed.
Frank
Why would anyone use Octave or Scilab when there’s Julia?
julialang.org
Paul W. Frields
@Frank: Odd question. For instance, some people want to transfer their Matlab scripts or skills to something similar. Thanks for letting people know about related projects, though.
Frank
Of course, I know! Just wanted to point out the superiority… 😉
Nick Dokos
The legend in Figure 2 reflects the old settings (before the colors and line width are changed): bug in octave?
Piotr
I drifted away from Matlab some time ago, but not to Octave nor SciLab but to Python + Numpy & SciPy + Matplotlib. Does Octave have the performance to keep up with Matlab or any Python-based solutions?
Frank
No, it doesn’t, just look on julialang.org at the graph you see way down. And you should definitely try it. Best example is using Juliaplots, which is just a common abstraction layer for several plotting engines, which you can exchange easily (take look at the GL renderer!).