


Historically it has been difficult for developers to reliably use some software profilers on Linux due to how distributions are assembled. Fedora Linux recently improved this so everyone may contribute to making Linux faster, more efficient, and reliable. This article will guide you through using performance profiling in Fedora Linux. It will also discuss how profiling works.
A software profiler helps developers improve performance by characterizing what is happening on a computer over a period of time.
This information helps to determine what changes are necessary for reducing energy usage, speeding up long-running tasks, or even locating hard-to-find bugs.
Eventually those changes become part of the operating system and applications which make it to users in an upcoming release!
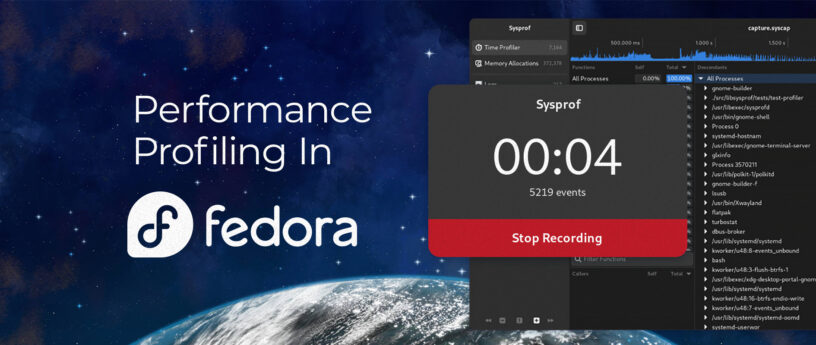
Fedora Linux 38 introduced “Frame Pointers” to improve the quality of information recorded by profilers. Fedora Linux 39 then brought a significantly redesigned Sysprof (system wide profiling tool) to make it simple to analyze and take action upon that higher-quality information.
Getting Started
The first thing we need to do is install Sysprof. It contains both a privileged daemon and an interactive GTK application.
sudo dnf install sysprof
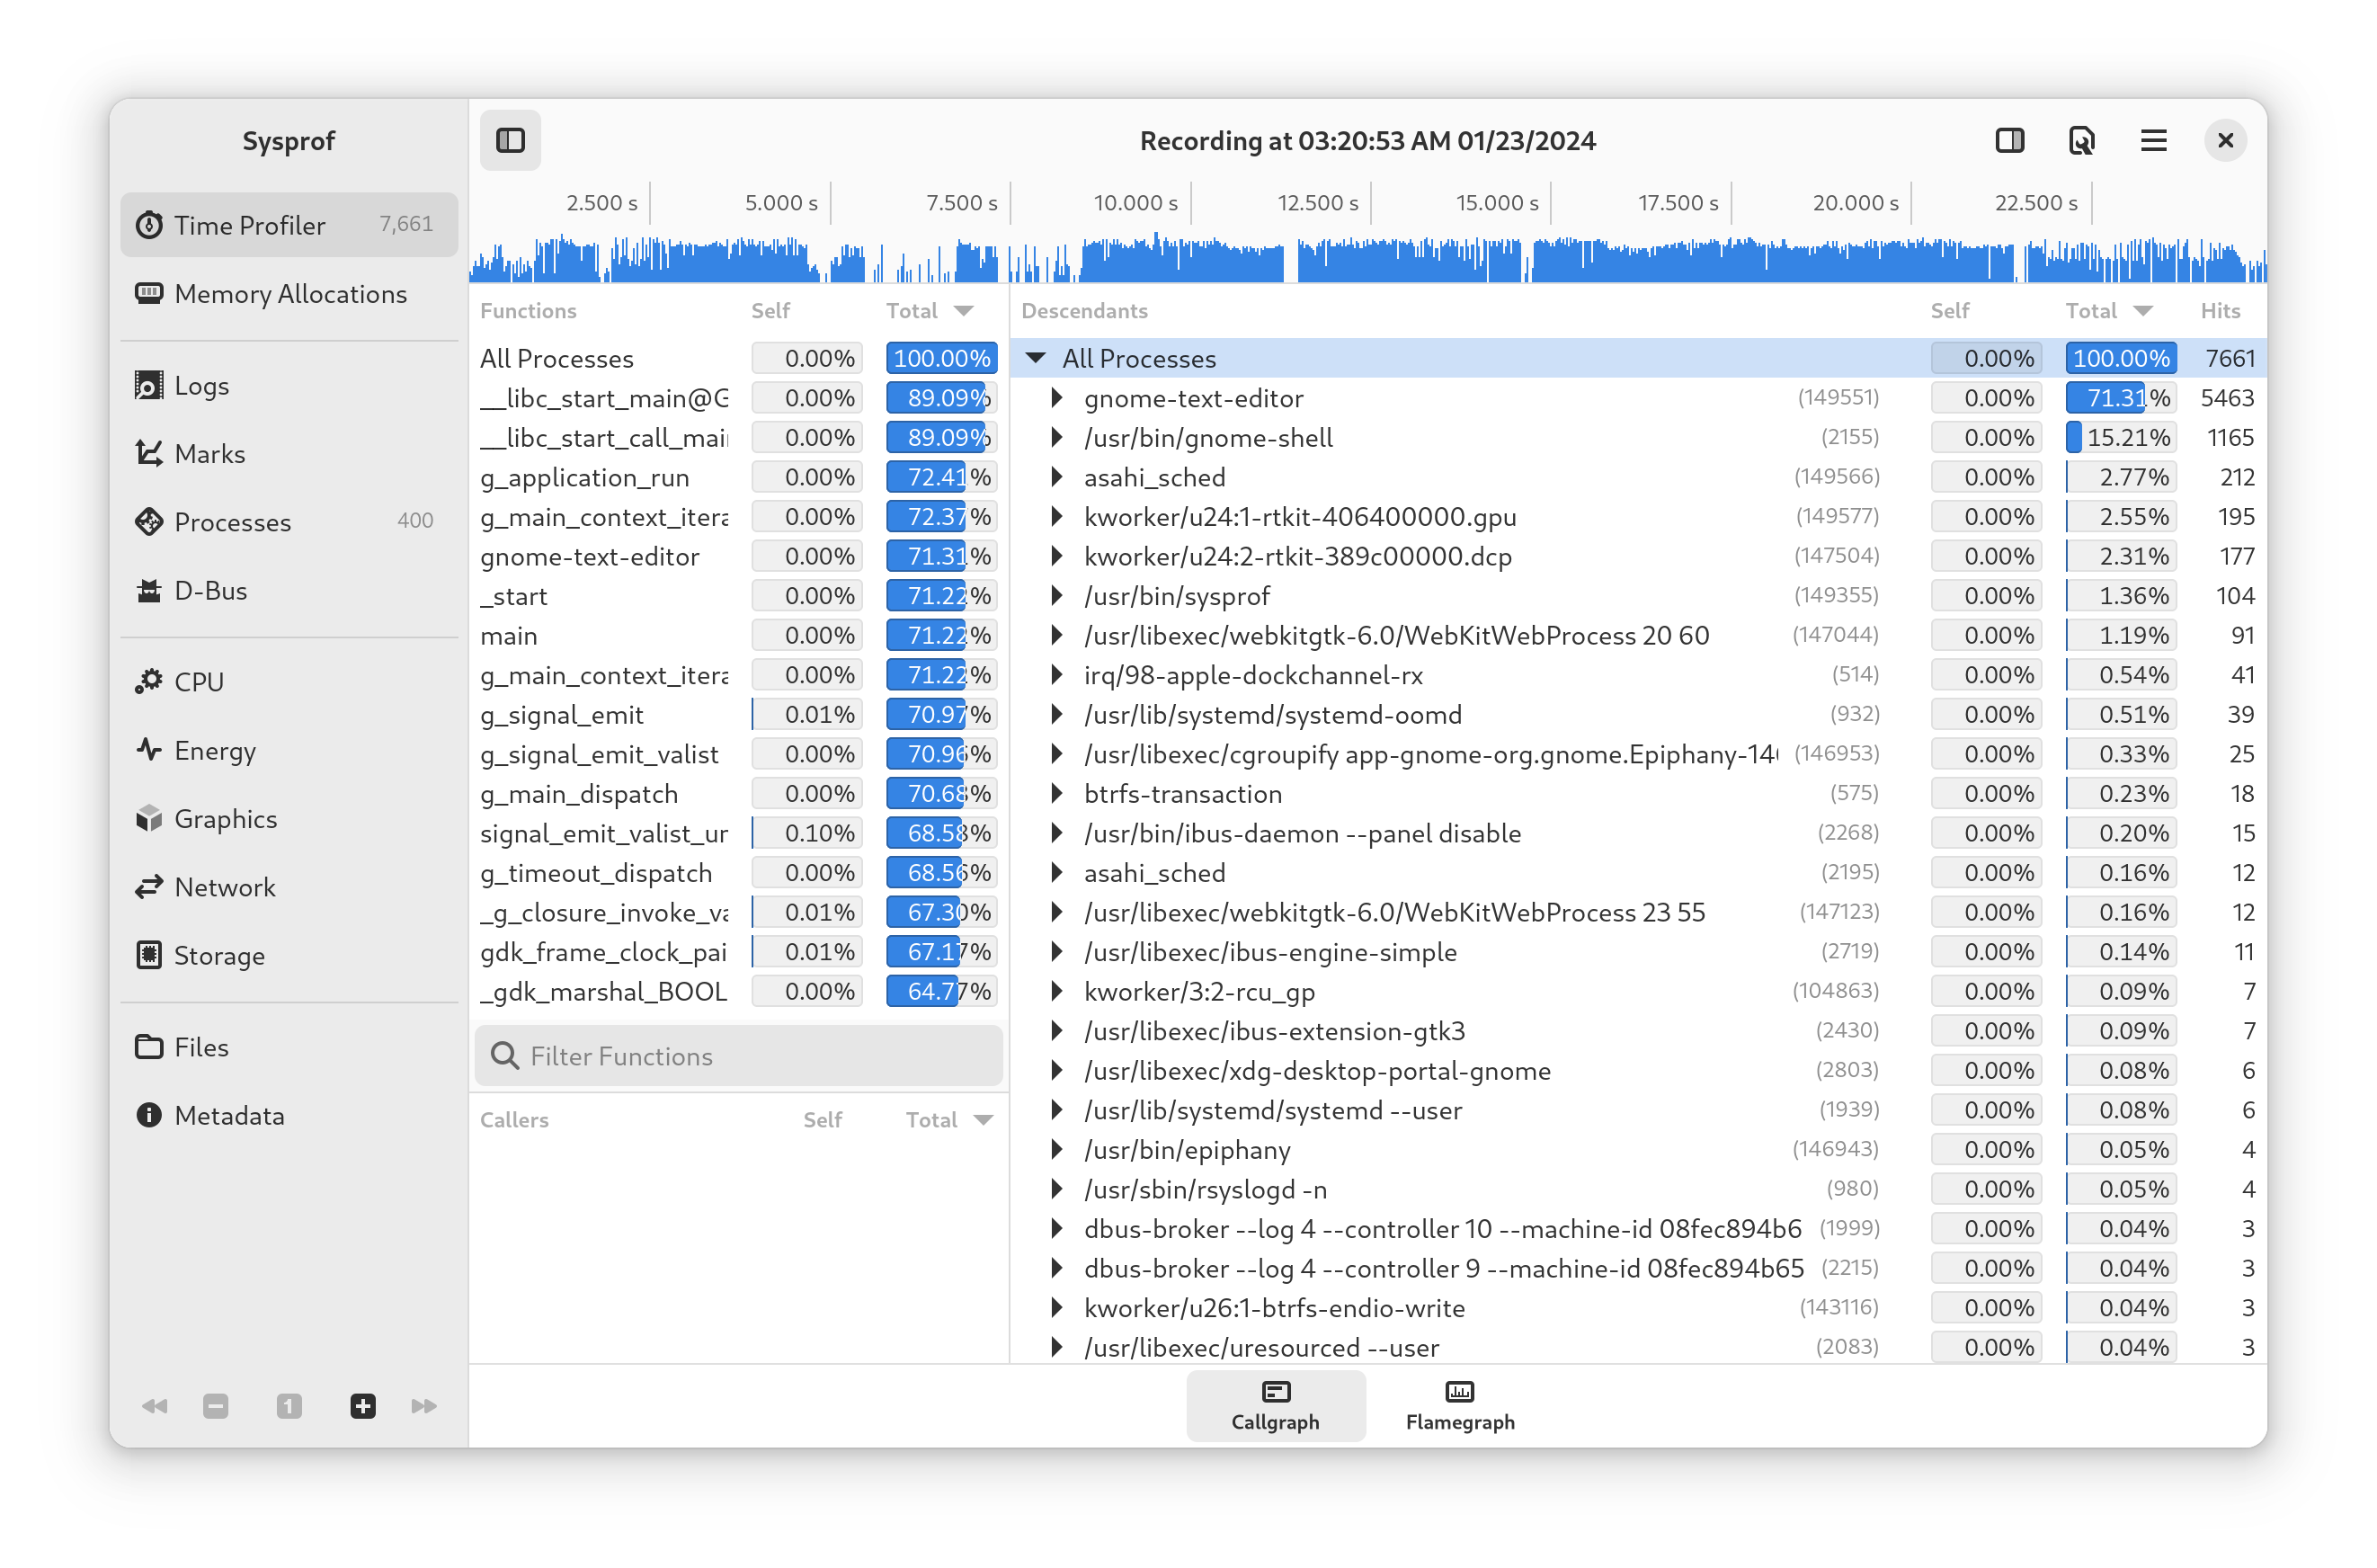
Let’s open the GTK application and use it to record what is happening on our system. It has sensible defaults so upon seeing the dialog we can click “Record to Memory”.
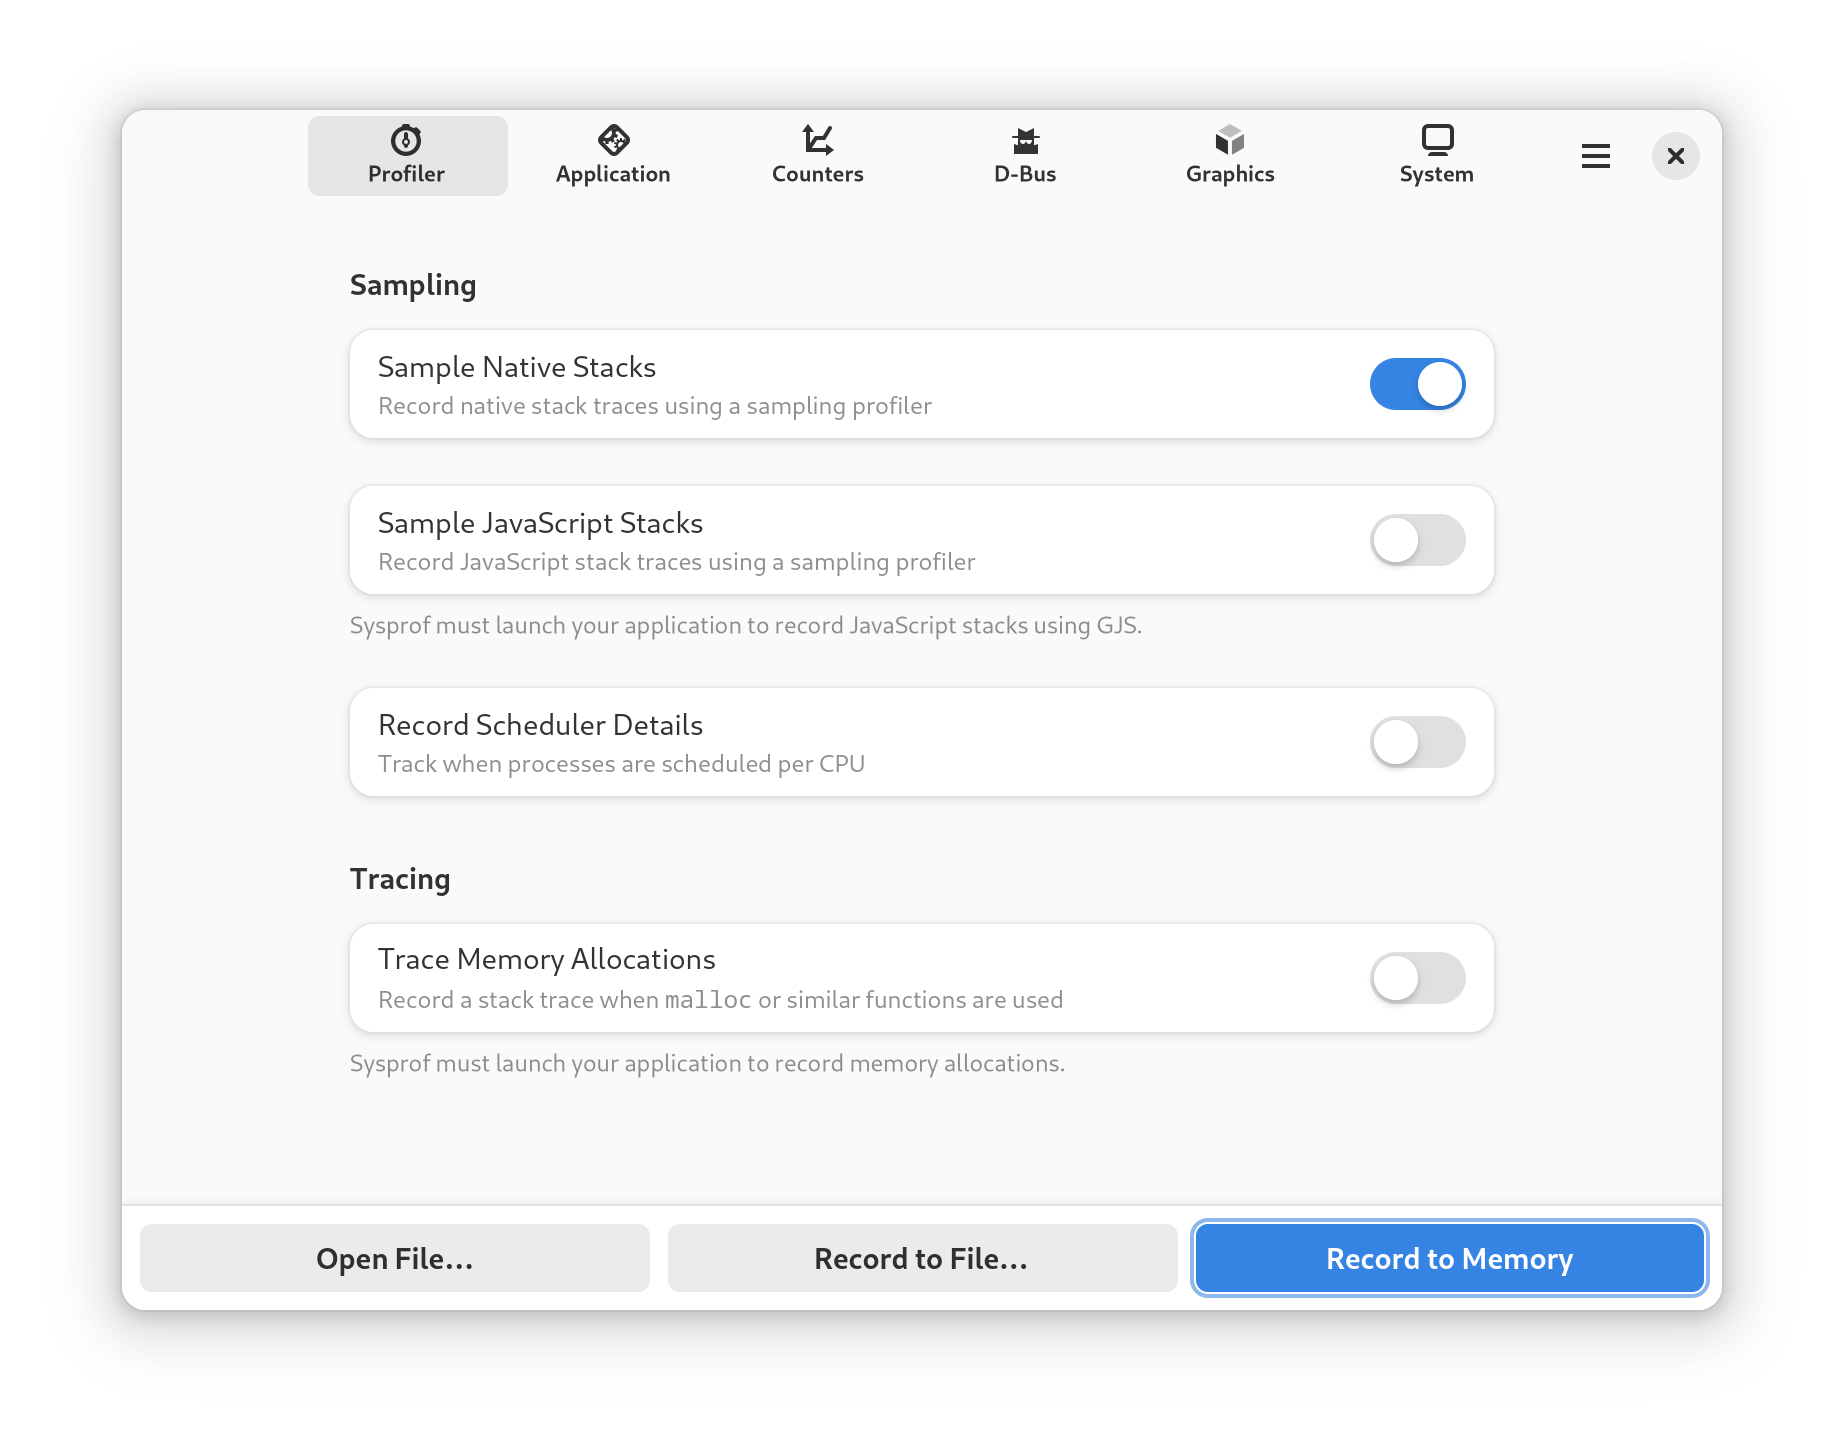
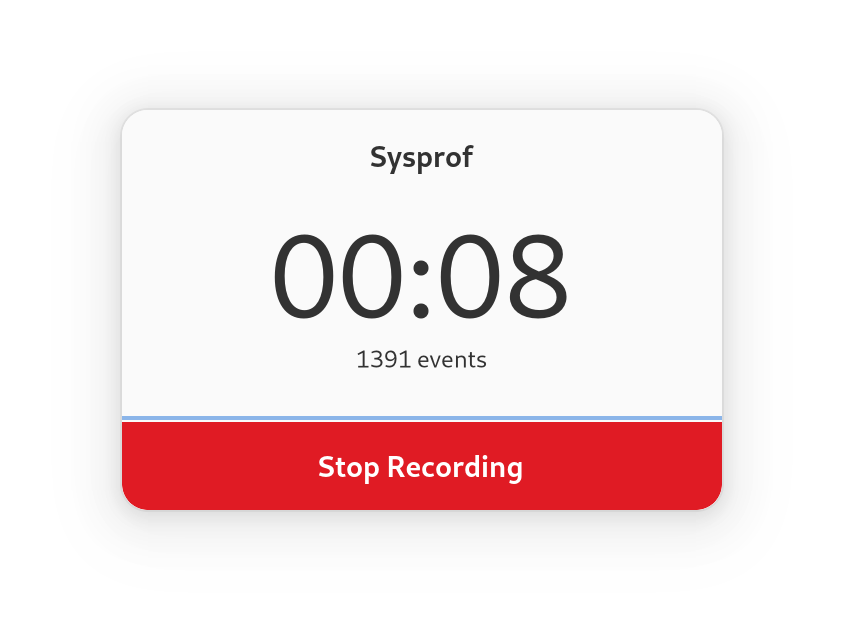
After selecting Record to Memory a small recording indicator will appear. This can be used to stop recording when the task of interest has completed.
While the profiler is running we exercise whatever application we want to gain more insight on. Alternatively, we might do nothing and just see what the system is doing while idle.
After about twenty seconds we select Stop Recording and the interactive interface will appear. This can now be use to explore what happened.
Note that you can also use the sysprof-cli command to record profiles. Use the Sysprof application to open and explore them. This may be useful when using SSH to access a remote host.
Stopping recording causes a callgraph to displayed. (We can also visualize the recording using a flamegraph.)
Selecting Flamegraph at the bottom of the callgraph will present the data as a flamegraph as shown below.
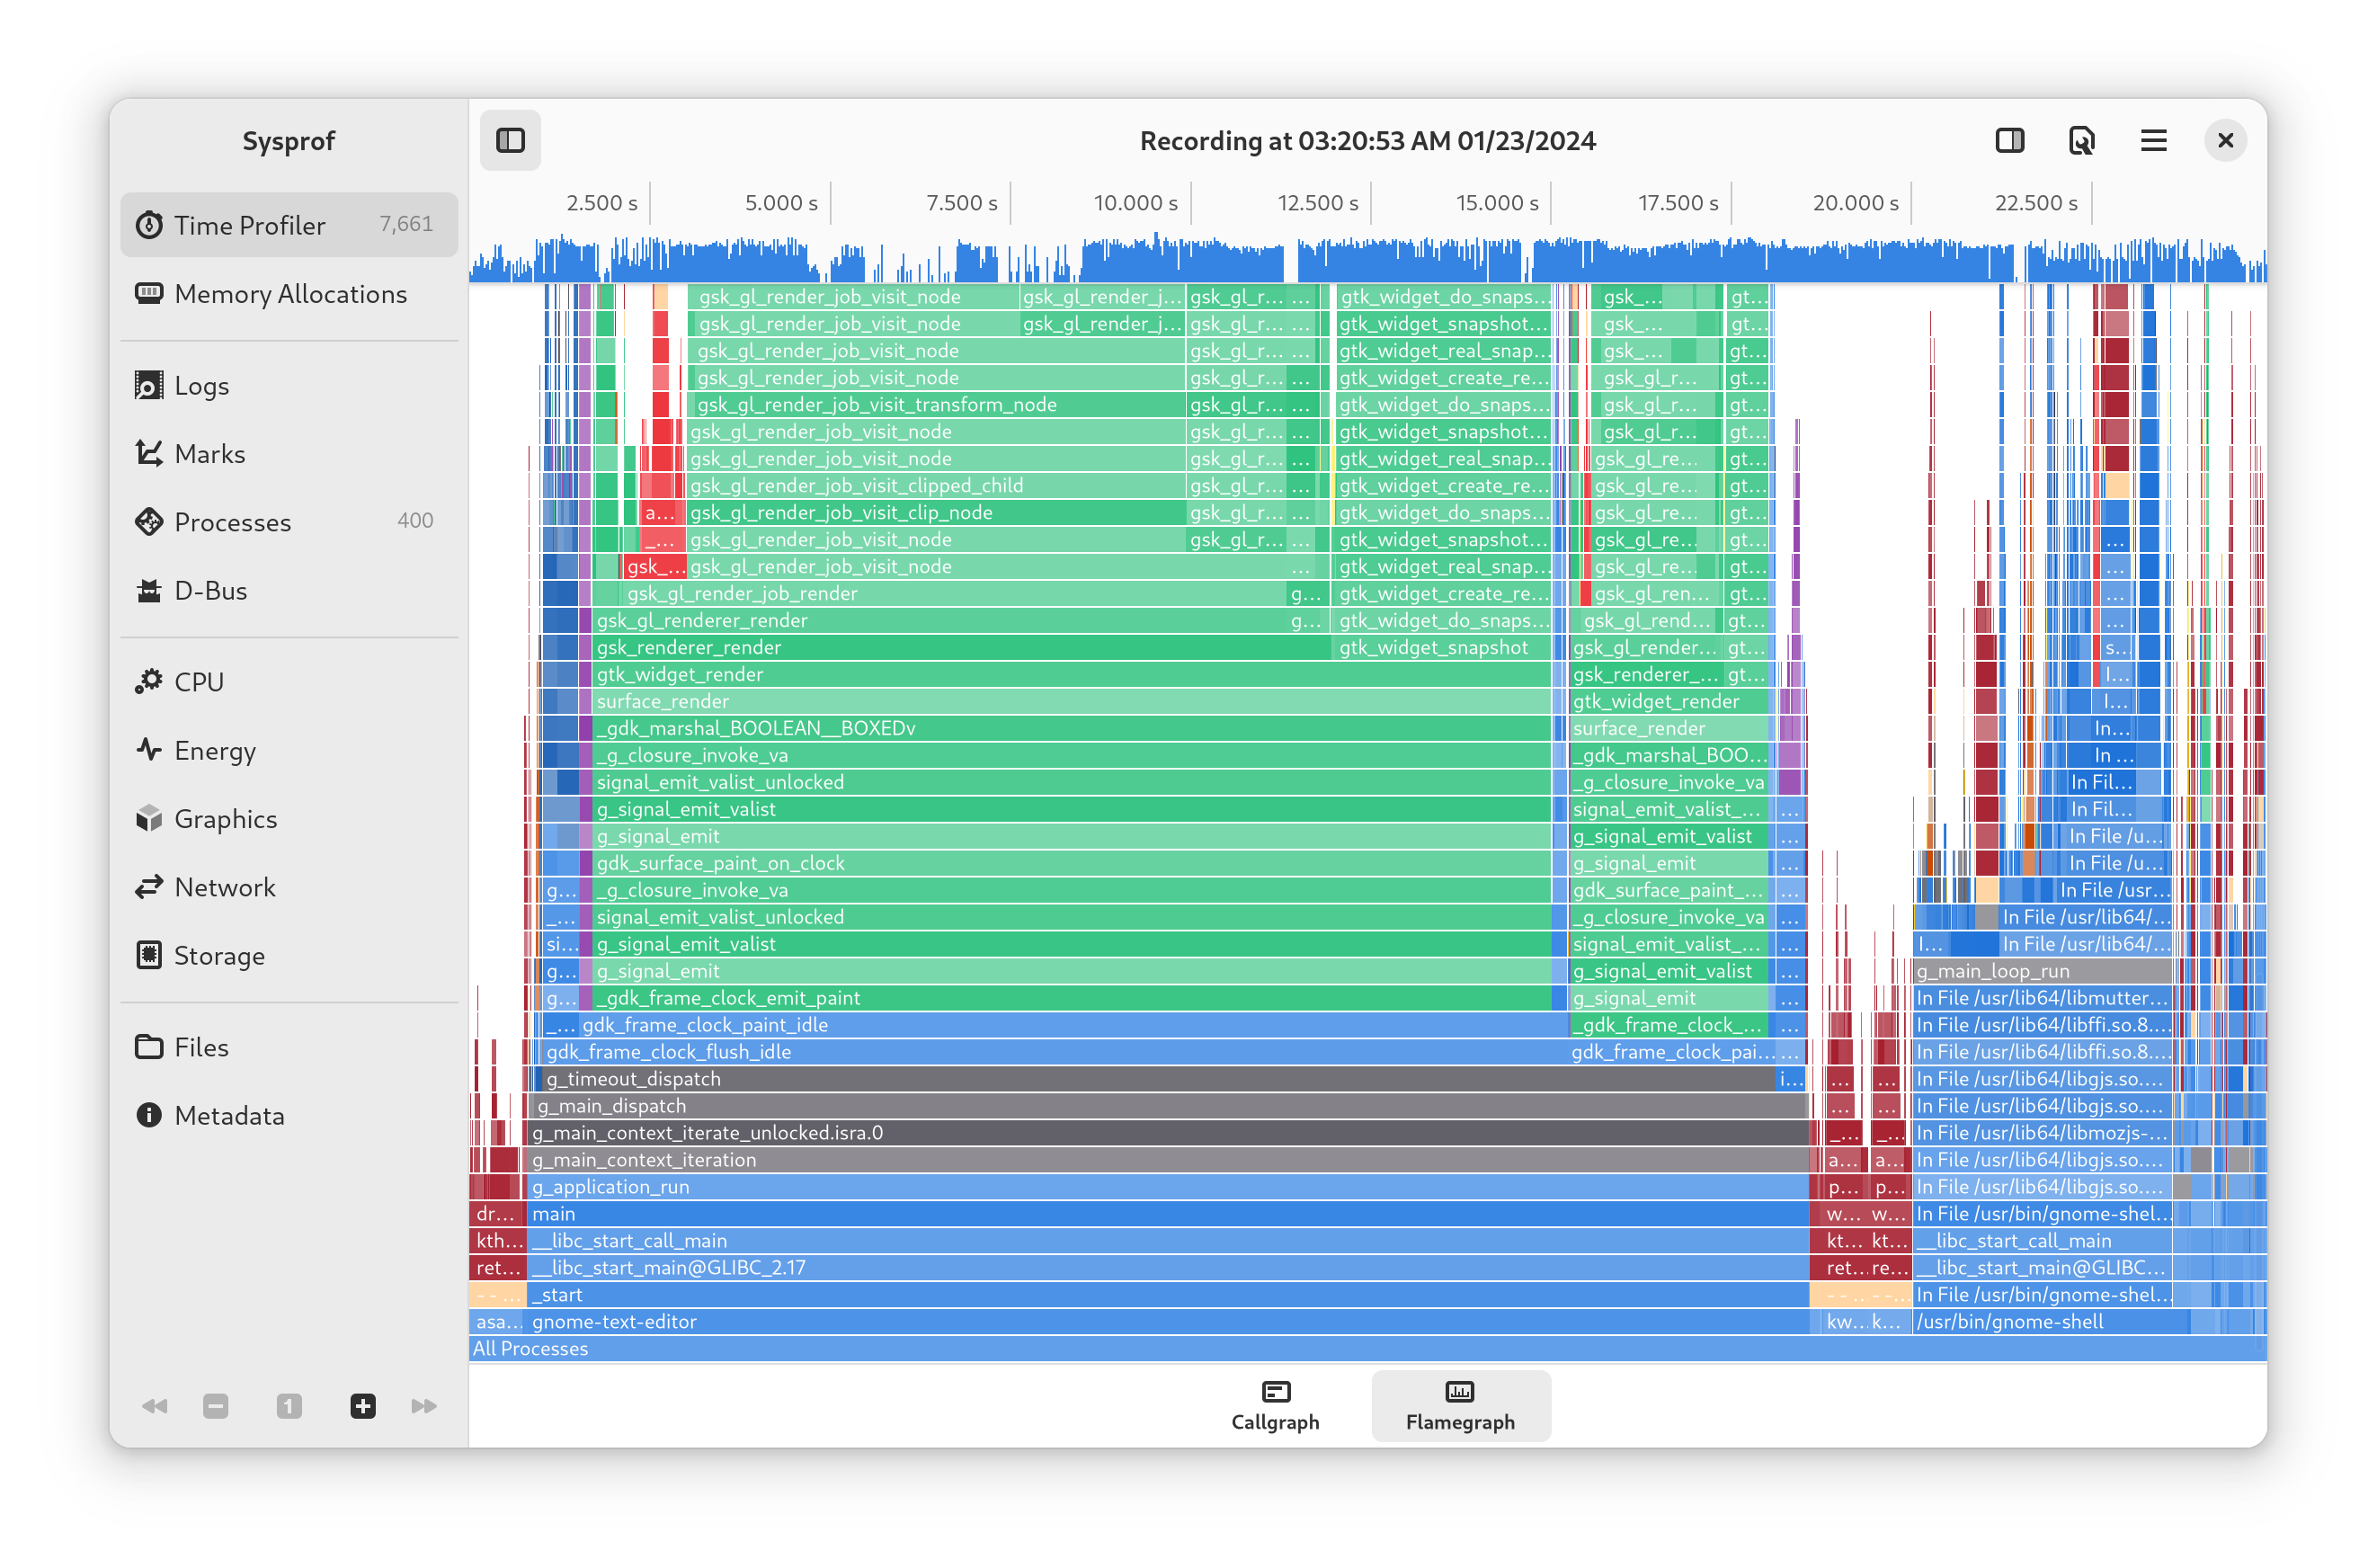
Use flamegraphs to get a high-level overview of what is happening. They can often be easier to interpret than a callgraph.
Interpreting Results
Interpretation is an art in and of itself but the gist is to look for sections which look large for what they should be doing. Having a skeptical eye can really go far, here.
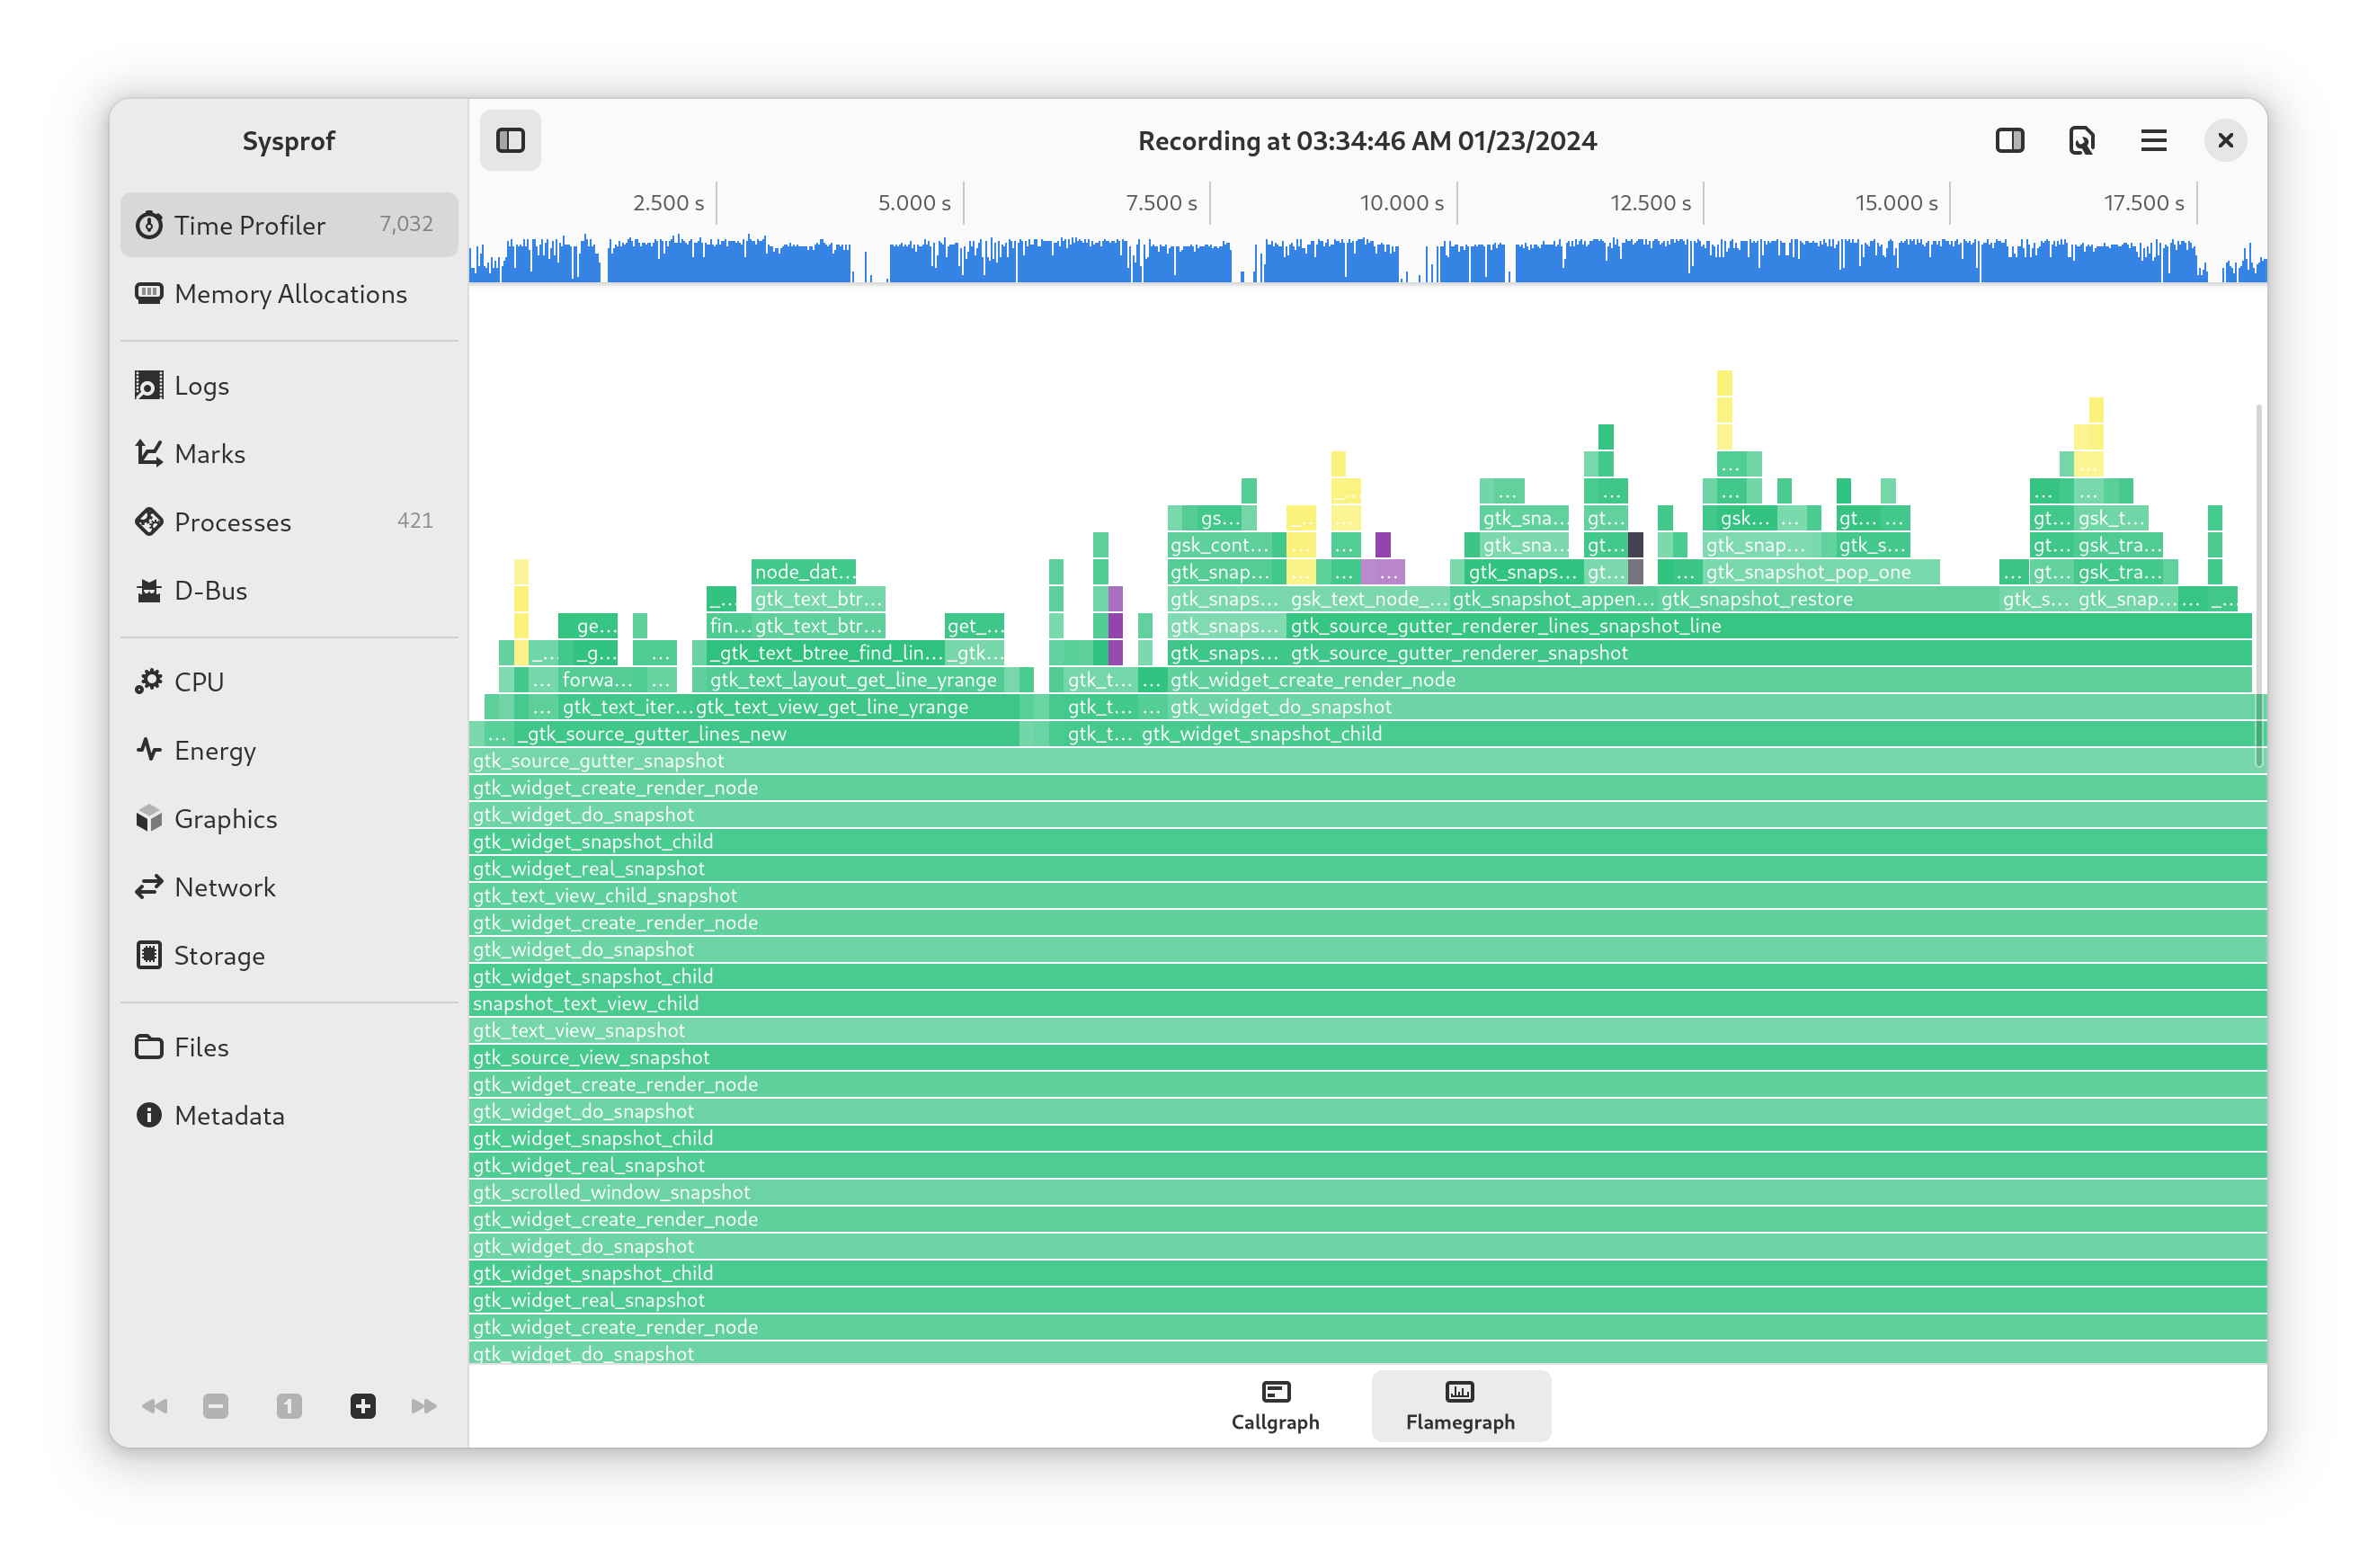
For example, here I’ve profiled GNOME Text Editor while scrolling through a large C source file to see how it holds up.
What I’ve recorded here shows that a large portion of the time it takes GTK to draw the window is related to line numbers. It’s nearly twice as much as the what it takes to draw the file’s visible content! We can see that by comparing the size of draw_text() and gtk_source_gutter_snapshot().
Surely that isn’t right!
If we dive into the suspect function gtk_source_gutter_renderer_text_snapshot_line() in the flamegraph we see that it is doing a lot of work with Pango and Harfbuzz which perhaps we could avoid.

After some changes to GtkSourceGutterRendererLines running the tests shows that the Pango and Harfbuzz overhead has almost been completely removed.
Testing the application confirms that scrolling performance does, indeed, feel smoother!
Improving performance is often a game like this. Take measurements by recording what your system is doing then pick something that will make an impact. Look for things you didn’t expect to see. The worst that can happen is that you learn how a component of your operating system works!
Getting Better Function Names
Sometimes Sysprof cannot determine a function name for a particular piece of code. Instead it might name the function something like In File libthing.so+0x1234.
You can often improve this by installing the debuginfo package for that application or library. For example, to get the debuginfo package for GTK 4 you could run the following command.
sudo dnf debuginfo-install gtk4
How does it Work?
If you’d like to know how profilers work this is a great place to start! We’ll cover the gritty details which can help you troubleshoot why your profiler of choice might break in a certain configuration.
Micro vs Macro Profiling
Sometimes you want to make a small piece of code extremely fast such as comparing strings with strcmp(). This is “micro profiling”.
Sometimes you want to focus on an entire system of interconnected pieces. This is “macro profiling” or as I prefer to call it “whole system profiling”.
This article focuses on “whole system profiling” because that has the widest impact for change. It allows you to see, at a high-level, what is happening across different processes and how one program’s behavior may cause performance issues in others.
For whole system profiling, a “sampling profiler” is necessary. A sampling profiler works by recording a “stack trace” of what a process is doing many times per-second.
Contrast this with a “tracing profiler” which attempts to record every function entry and exit. A sampling profiler tends to have a fixed upper bound on overhead while a tracing profiler has overhead per-function call/return. Simple tracing profilers can be extremely misleading when looking for performance issues.
What is in a Stack Trace?
A stack trace contains one or more “instruction pointers”. Each instruction pointer is a memory address to a CPU instruction. As a function calls into another function a stack trace would get deeper. Upon return it will get shallower. Sometimes a single function is so complex the compiler will break it into smaller functions for you, but the mechanics are the same.
Application executable code is “mapped” into memory across various address ranges. If you know which file is mapped at the address where the instruction pointer points to then you can discover what function was running. This is because the executable file (ELF) can contains the address range for a symbol.
When the address range is missing it sometimes points to another file using a special section called “.gnu_debuglink”. That referenced file will, instead, contain the information we are looking for.
Recording Stack Traces
Most sampling profilers on Linux work by using the “perf” subsystem of the Linux kernel. It provides the hooks to record stack traces at regular intervals from both the kernel and user-space.
This is done by “unwinding” the stack for a particular task. Some tasks may use a syscall to transition from user-space to the kernel. Linux’s perf can blend this into a single stack trace providing valuable insight into application performance.
How the kernel unwinds the stack depends on the configured “unwinder”.
In many kernel configurations the Linux kernel will unwind tasks within the kernel using “ORC” with frame pointers omitted. The ORC unwinder generates information about how to unwind from any instruction pointer within the kernel. It’s format is concise and provides fast unwinding without the use of frame pointers.
ORC is not currently suitable for user-space so another technique must be used.
User-space tasks use the “frame-pointer” unwinder. This traverses each stack frame using the frame pointers compiled in the kernel. If a piece of software was compiled without frame pointers then unwinding will generally stop short of the tasks entry point providing incomplete results to the profiler application.
Frame Pointers
A frame pointer is a technique that makes a “linked list” out of stack frames. When calling a function the current stack frame register is saved to the stack. The register is then updated to point at the new stack position. When returning from the function the reverse is done.
This allows traversing each stack frame starting from the current stack position because you know where to look next from that saved register value. Hence, a “linked list”.
This technique makes it very quick to build a stack trace at the cost of slightly larger binaries as they have to insert function call prologues and epilogues to perform stack frame tracking.
One concern is that increasing the number of instructions could add pressure to the CPU’s instruction cache, thus, theoretically, hurting performance.
Compilers that Omit Frame Pointers
Some types of compiler optimizations make determining the function involved increasingly complex to the point that it cannot be done in real-time without slowing down a system.
This is because the compiler may have entirely optimized out the use of a “frame pointer register”. The idea behind this technique is that it frees up one additional general purpose register for complex operations in your application or library.
Omitting frame pointers made a lot of sense in the days of 32-bit x86 because general purpose registers were so few in number. You might see performance improvement there at the cost of making the compiler more complex to track exactly what registers are necessary across a number of functions only to insert a frame pointer if necessary.
Some architectures require the use of frame pointers, such as aarch64. Omitting them is not practical there.
Modern x86_64 machines rarely see a similar performance improvement from the omission of frame pointers except in some micro benchmarks.
Why Compiler Defaults Matter
Frame pointers were added to Fedora Linux by changing the default compiler flags for RPMs. It was commonly asked why everything needed to be compiled with frame pointers rather than just a library here or there or just on developer machines?
The inconvenient answer is that any function in a stack trace can break the ability to unwind. If you have 10 stack frames but one in the middle omits a frame pointer then stack unwinding may only find 5 frames.
This matters when you want to visualize your profile. If you can’t get to the root stack frame of your thread then you cannot reliably visualize what is happening in the program with callgraphs or flamegraphs.
Tracking down performance problems in production requires the ability to get insight on those systems. When a performance problem happens in production, you can’t make the first step to insight require installing a series of different libraries, applications, or a specialized Linux distribution. Doing so could break the production environment further!
Similarly, Fedora Linux users’ computers are our production. If the first step to figuring out a performance problem on your system is to install a completely different set of packages then we’re unlikely to get user cooperation in troubleshooting performance bugs. That isn’t good for anyone.
Alternatives to Frame Pointers
Frame pointers aren’t the only way to unwind or generate a stack trace. Alternatives, however, do currently present some problems in the context of profiling.
DWARF and .eh_frame
A common technique used to build a stack trace within a running program is to look at a specialized virtual machine for debugging C and C++ programs. The DWARF debugging format contains instructions that can be evaluated to unwind the stack given any instruction pointer and current register values. Similarly, the .eh_frame provides similar information used in C++ exception handling. Since C applications are required to provide this the .eh_frame data may be used there too.
These instructions are commonly quite simple but the virtual machine itself allows for a lot of complexity. The Linux kernel removed its support for unwinding with DWARF and thus requires the unwinding to be done offline in user-space.
To do this unwinding in user-space, perf must first capture the contents of a thread’s stack. The contents are copied to the perf stream which is read by the profiler.
Unless all stack traces are within the hard-coded stack size you specified when recording, you risk having truncated stack traces. Once again this can make accurate visualization problematic. This is quite apparent on applications using graphical toolkits which regularly have deep stacks.
It is also slower to record thread stacks. This can get in the way of what you’re trying to profile. It can add both memory and storage pressure.
eBPF Unwinding
More recently there has been interest in implementing stack unwinding using eBPF (Extended Berkeley Packet Filter) programs inside the Linux kernel. This is a promising future direction for performance profiling on Linux!
One restriction with the eBPF unwinding techniques is that it needs to be front-loaded with tables used to do the unwinding.
This creates additional memory pressure on systems where you may not be able to test the conditions you were attempting to profile.
It also must react to new processes starting. This is problematic if application startup is what you need to profile. Particularly in scenarios like the desktop where many processes start and communicate concurrently.
Containers prove an additional challenge because resolving the files that you need to build those tables may be through an opaque file-system like FUSE or deleted from disk. If you don’t have this information at-hand then you will not get anything to unwind.
Compare this to using frame pointers where you will at least get a stack trace even without access to symbol information.
SHSTK and LBR
Shadow Stacks (SHSTK) and Last Branch Records (LBR) may provide suitable hardware support for stack unwinding in the future without the use of frame-pointers.
At the time of writing, there is not yet wide support for them in the tool-chain or on a large number of systems used by the Fedora community.
We want the Fedora community to be able to participate in performance improvements which means supporting the hardware they already have.
Opportunities may arise in the future to compile libraries for specific hardware revisions that are guaranteed to have SHSTK or LBR support. These could potentially omit frame pointers.
SFrame
Another promising improvement over frame-pointers is SFrame. It provides techniques similar to ORC but for user-space. It is still a bit too early to say what will happen with SFrame as far as Linux distributions go but there is support for it in binutils.
What we currently know is that it is not as compact as DWARF unwinding instructions but would provide faster unwind support. It is also limited to x86_64 and aarch64.
A kernel unwinder is also necessary for SFrame and would require access to a .sframe section of applications and libraries without page-faults. Some future kernel work may allow for that to change though this author believes it will require obtrusive changes to the perf event stream.
Symbolization
To make stack traces useful we need to go from instruction pointers to function names and, if we can, source code line numbers.
If an instruction pointer falls within an exported symbol then it is likely we’ll be able to get a function name from the ELF loaded into memory. If not, we may need to find a corresponding “debuginfo” ELF which contains more detailed references from address locations to function names.
Many people are under the incorrect belief that installing the debuginfo packages will help you get better stack traces when profiling. These packages will only affect your ability to get better function names or source code locations. They have no effect on the Linux kernel’s ability to unwind frame pointers.
After acquiring the function name from either the ELF or the corresponding debuginfo ELF, additional demangling may be necessary. Both C++ and Rust may provide symbols in multiple formats which should be converted to a human readable format.
Container Namespaces
It is increasingly common to use containers for both development and application deployment on Linux. Container namespaces are in play whether that is Podman, Docker, systemd-nspawn, or Flatpak.
This adds complexity in symbolization because the process which is doing symbolization may not have a complete view of a container namespace. In fact, that process may not even be around anymore by the time symbolization happens.
There are both PID namespaces and Mount namespaces which need to be resolved properly for this to work.
For example, say we want to find the location of /usr/lib/libglib-2.0.so for a profiled process. One might expect it to be in the same location. However, on Linux there is the concept of mount namespaces and it is at the core of container technology. What one process sees for libglib-2.0.so could be very different from another profiled process.
Remember how we need to translate .gnu_debuglink references noted in ELF sections? Those must also be resolved using the mount namespace of the profiled process.
In the Flatpak case, library and application debuginfo is provided by a separate debug runtime so extra path translation may be necessary to get detailed symbol names.
In other cases you can use a device and inode number to verify you have the right file. If you have a FUSE file-system involved that is unlikely to work and specialized workarounds are necessary.
In some cases the debuginfod project can provide symbol information albeit at a performance cost. This author has found it too slow for practical use in Sysprof.
File-system Subvolumes
Many users, sometimes unwittingly, are using a more advanced file system feature called “subvolumes”. These can present challenges when profiling because some containers may not have access to the same subvolume. When they do, it may be mounted in a different location.
Sysprof will attempt to model the mount namespace of both the profiled process and itself to make a best attempt at locating applications, libraries, and their respective debuginfo files.
Making Symbolizing Fast
Even with relatively short profiles we may have hundreds of thousands of instruction pointers to symbolize. Each user-space process has its own memory layout but the kernel address space will look the same.
If symbolization is not fast people will look to other tools that may not provide the same level of detail as software profilers.
To make symbolization fast, Sysprof contains an interval-tree for each process based on a red-black tree. It also contains one for the kernel.
Once we know the address range for a function, all future look-ups in that address range can be answered without looking at the ELF files on disk.
In practice, this speeds up symbolization so that it feels almost instantaneous.
Supplemental Data Sources
Having reliable stack traces over time is incredibly useful alone. But what if you could correlate that to other system information too?
Sysprof includes integration for numerous other data sources so you can dive into specific periods of time and see what was happening.
System Counters
Many system counters are available for correlation.
It includes both CPU usage and CPU frequency. This can be helpful to quickly locate and dive into troublesome system performance.
Network counters allow pinpointing when a network request was made. Similarly disk counters can allow you to see what code was running during a large disk IO.
GTK and GNOME Shell
One thing we like to see on our desktops is smooth application and compositor performance. To help us in that endeavor Sysprof provides frame-timing information.
Both GTK and GNOME Shell can export frame timings to Sysprof, when configured. This allows you to see what was happening up to the point a frame deadline was missed.
Memory Profiling
In addition to sampling based profiling, Sysprof can inject code to trace memory allocations in your application. This can be useful when you want to find memory heavy portions of an application which might benefit from alternative solutions.
JavaScript
If your application uses GJS, backed by SpiderMonkey, Sysprof has integration which will allow you to see JavaScript stack traces.
Unlike Linux perf, this uses a timer within the application which stops the JavaScript interpreter and unwinds the stack.
For the application developer trying to track down performance, Sysprof will show you callgraphs and flamegraphs using these JavaScript/C++ interposed stack traces.
Scheduler Information
We often think of our programs as running continually even though the process scheduler is constantly swapping out one process for another.
Sysprof can include the timing information of the scheduler so that you can further see why you may have performance problems. Maybe a program is swapping between CPUs too often? Maybe too many other processes were higher priority?
It’s all visible with extreme detail.
D-Bus Recording
The most common inter-process communication model between applications on the Linux desktop is D-Bus. It allows processes to communicate in a variety of ways.
Sometimes, applications may use this technology in a not-so-efficient manner. At other times it might just be that the application is doing something slow in response to a request.
To help track down these sort of issues, Sysprof can record messages on the session and system bus. You can correlate the timing of these messages with what code is running in your profiled applications.
Case Studies
Towards the end of the Fedora Linux 39 development cycle I spent a little time optimizing some issues I found using Sysprof.
Many of these improvements are in code-bases that I’ve not contributed to before. Given the insight from Sysprof and profiling on Fedora Linux, that didn’t matter. It was simple to locate and triage the problems.
GNOME Search Providers
While creating Sysprof for Fedora Linux 39 I would spend time testing it on my system. I kept noticing numerous search providers showing up in profiles even though they had nothing to do with what I was doing.
One by one, we looked at each search provider to see what is going on.
Some of them proved more difficult to fix than others. For example, gnome-weather required adding a complex data-structure for discovering geospatial distance. Others were often simpler and just required avoiding duplicated work.
GLib and GObject
The GLib library provides common C utilities and data-structures for all sorts of applications. It also includes a basic type-system in the form of GObject. This is used as the basis for GTK as well as GNOME Shell.
Finding performance issues in GLib can have wide reaching implications because it affects so many applications and daemons.
While profiling GTK application performance, I noticed a curious thing. We were spending an awful lot of time inside the type system rather than doing application work.
Once again, Sysprof points us right at the problem and a few patches later we see type system overhead within GLib nearly disappear.
systemd-oomd
Ensuring systems stay idle when unused is essential to improving battery life.
A quick recording, while my laptop was otherwise idle, kept revealing systemd-oomd multiple times per-second. How curious!
A quick look at the code, and a post to the mailing list, showed that this was expected behavior but one that could potentially be avoided.
One very small patch later we start to achieve longer periods of time without any code waking up the CPU. Exactly what we’re looking for!
VTE Terminal Emulator
One of the bigger performance improvements is coming to terminal users in Fedora Linux 40.
VTE is a library for writing terminal emulators using the GTK graphics toolkit. This library is used by GNOME Terminal, Console, xfce-terminal, and many others.
The library has a long history within the GNOME project dating back more than 20 years. In fact, it was one of the first terminals to support anti-aliased fonts.
The feature-set of VTE is expansive. However, it was designed in the era of X11 where you were lucky if you even had working graphics drivers.
We can see the cost this has on our system. Many of us live in terminals all day. So inefficiency here has wide impact!
Sysprof quickly points out we are spending a huge amount of time in the Cairo library to draw terminal contents on the CPU. GTK 4 is rendered with the GPU so it must also upload the image to the GPU!
GTK has support for rendering UI and text on the GPU. Why don’t we make it do that!
After a bit of work to refactor VTE to take advantage of this we can see significant drops in CPU usage while increasing our frame-rate. At best we were drawing around 40hz when we started while consuming considerable CPU. After refactoring we can easily reach 240hz and little CPU usage even with full screen updates.
While improving the drawing performance of VTE I found many other things to improve. Such is life for software with such a long history. Double digit performance improvements were found by optimizing the boring stuff like array usage, UTF-8 decoding, compression formats, and ensuring that the compiler “inlines” what you expect it to.
In the end we were able to nearly double the performance of VTE for many common use-cases.
Moving Forward Together
We all want a better and faster Fedora Linux. Sysprof tries make it easy for you to join in and make that happen in your favorite software projects!
I’d be honored if you gave profiling a shot and helped us on that journey.

Darvond
How amusing; this entire concept & application fights against the entire idea of Gnome’s padded cell philosophy yet still falls to the Fisher-Price idea of UI/UX construction.
…Oh, gross. This makes use of the same gtk libraries that makes sure Lutris, winetricks, and a few other applications don’t match any desktop one might use it on. Thanks for the non-compliance and lack of being intermodal, Gnome. This looks hideous in WindowMaker, by the way.
Attempting to run sysprof-cli, it fails to proc eglinfo which wasn’t even a requirement for installation, so slow clap. (One trivial 90 kb installation that should have been a leaf later…)
While it runs, it doesn’t even suggest what it’s doing, where the file is being saved, or how much data is recorded, nor does there appear to be a sane default for how long the profiler should run.
In trying to profile Lutris, [# sysprof-cli lutris] instead of logically doing that, it spits out a file named Lutris. And in attempting to su sysprof, Lutris yells to not run it as root and closes promptly.
And one were try to do what one would think to be logical, to run sysprof-cli /bin/lutris/, it assumes the want to overwrite Lutris instead of profiling Lutris. Good thing this wasn’t pointed at anything important.
This is shockingly bad interface design.
Good concept. Fascinating idea. Gnome execution.
duh
I guess breaking the toy by forcefully trying to mash the square peg in the triangle hole is a gnome issue for you…
sysprof profiles the entire system, as it is clear by its man page, if it wasn’t by the name alone, or just by reading a few lines of the article you’re commenting.
Krisselack
Wow, this article is a really exciting read, especially the usage of analysis for system-improvements. Thank you!
szydell
Thanks! An excellent article. 🙂
hammerhead corvette
Finding things like systemd-oomd being a bug and potential for extending battery life, preserving sleep, suspend or hibernation is tantamount to improving the Linux experience. Great read, and one i will look over again.
newton
na verdade nosso Linux seria toda tecnologias que existe em todo sistema deste planeta ,mas a grande dificuldade seria dar facildades para navegadores que usam o sistema ,sem entender o sistema ,mas nosso Fedora vem crescendo neste quesito ,amo tecnologias e muito nosso Linux obrigado
bsals
Please ignore that other person. While I don’t use Sysprof, I love that it has made my laptop faster than ever.
Thank You!
Kev
Great job! Wonderful detail. I see Ubuntu recently announced they’re enabling FPs by default, so great leadership by Fedora
Ondřej
Unbelievable. I will have to reread the article tomorrow and try to understand it better. 🙂
So much information, so much value, thanks for your contributions and this explanation.
Frank Ch. Eigler
Considering that this is a fedora focused article, I wonder why it suggested manual “sudo debuginfo-install” runs, instead of relying on the fedora debuginfod server? It may also help with the container namespace mismatch issues too.
Christian Hergert
Virtually everyone I’ve talked to disables debuginfod on their workstations. So it’s not something I’ve focused on in Sysprof (yet).
It’s mentioned in the article but debuginfod is too slow for keeping up with decoding the whole system after running a recording. It’s the same problem we have with gdb. The last thing we want is to wait for minutes to download symbols just to start gdb.
It’s more useful to get immediate results than to wait potentially 10s of minutes on acquiring debuginfo symbols.
The captures contain enough information to work if the symbols are installed later so that is the lowest overhead (in terms of time) way to get answers.
If/when debuginfod gets faster for the number of symbols that need to be acquired for the entire system, libsysprof has a symbolizer abstraction. One could be written which queries debuginfod.
Truls Gulbrandsen
I suppose this is something you can do from time to time.
However, I would think privacy would be an issue? How is privacy managed in this context?
DG
Fedroa -> Fedora
Gregory Bartholomew
Fixed. Thanks. 🙂
kalevi
Great article and lowering the barrier for profiling is good news. There are not too many user friendly profilers on Linux and I’ve always wanted to see something like Instruments on Mac for various traces just for fun while using perf/cachegrind for things I’m developing.
Frank Ch. Eigler
Oh no! 🙂 Please let us know when it’s annoying enough to do this. There’s some work going on to fix some known problems, but the more we know of, the better. For example, the dreaded vdso debuginfo download is hobbled due to https://bugzilla.redhat.com/1970578 – But we’re thinking of ways to work around this kernel packaging problem using more clever caching in debuginfod.
https://sourceware.org/bugzilla/show_bug.cgi?id=31265
For another example, gdb is receiving improvements soon to download only a small fraction of a full DWARF file initially (.gdb_index), which accelerates amazingly. It’s being reviewed upstream.
It’s also possible to set low download timeouts.
We are interested in doing whatever we can and whatever it takes to make debuginfod compelling even to picky developers. Please report problems instead of suffering quietly (and turning it off)! Thanks!
Christian Hergert
Very glad to hear it!
Another thought I had was that we could back it with FUSE and only grab the pages we need. It’s usually very few pages per debuginfo file.
Mark Wielaard
Maybe what is needed is a scanning/background download mode for debuginfod? So you could sysprof in “scanning” mode where it initiates downloads for any debuginfo for the build-ids it sees, or maybe just writes out the build-ids. So next time the user has all debuginfod files in cache (or can run debuginfod-find on the saved build-ids) and no actual downloads are needed.
Frank Ch. Eigler
By the way, the debuginfod caching improvements in PR31265 have landed on the fedora servers. It can’t promise the world but it may be better enough to reconsider.
Dan Berindei
Thanks Christian, sysprof looks pretty awesome!
I have an issue with the delay between the time I press Super and the time the Gnome Shell overview appears getting longer and longer, until eventually (usually after a couple of days) it doesn’t show at all. Having just discovered sysprof, I tried to profile my system while it’s preparing to show the overview, but obviously most of the stack frames are compiled JS.
Is there a way I could tell gnome-shell to produce the JIT-mappings so that sysprof can find them if/when I start profiling, or is starting gnome-shell with
and recording my entire session my only option?
Christian Hergert
At the moment there is not. We don’t get address ranges from the SpiderMonkey profiler so we have to ask it what the function name is at a particular instruction pointer while creating the mixed native/JIT stacktrace.
On your particular issue though, make sure you’re running against a development GNOME Shell snapshot because there has been considerable work on this for the GNOME 46 cycle. I think it was something related to leaked GSignal connections.