


InfluxDB offers very complete query capabilities, and it is also pretty good at storing time series data. In this article I will demonstrate how you can use existing performance collection tools with InfluxDB as the storage for the captured metrics.
What you will require for this tutorial
- A Docker or Podman installation, so you can run an instance of InfluxDB; you can also do a bare metal installation, but I won’t cover that here and instead will use a container.
- InfluxDB 2.7.4 or better.
- A Linux distribution. I used Fedora Linux.
- Python3 and some experience writing scripts.
Running an InfluxDB server from a container
This is maybe the easiest way to get you started; We will use an external volume to persist the data across container reboots and upgrades (please check the container page to see all the possible options):
$ podman pull influxdb:latest

$ podman run --detach --volume /data/influxdb:/var/lib/influxdb --volume /data:/data:rw --name influxdb_raspberrypi --restart always --publish 8086:8086 influxdb:latest --reporting-disabled

$ podman logs --follow influxdb_raspberrypi
If you run this container on Fedora or Red Hat Enterprise Linux (RHEL), use option Z when mounting a volume to ensure it receives the correct SELinux labels.
Our running container is called influxdb_raspberrypi. The
Integration with Prometheus
What is Prometheus?
Prometheus is an open source systems monitoring and alerting toolkit originally built at SoundCloud by ex-Googlers to monitor metrics on their servers and applications.
The InfluxDB website has good documentation that explains how to integrate Prometheus with InfluxDB as the database backend.
Setting up the node-exporter agent
We will run a program called node-exporter, which will be responsible for capturing Linux metrics:
$ curl --location --silent --output ~josevnz/Downloads/node_exporter-1.7.0.linux-amd64.tar.gz --fail https://github.com/prometheus/node_exporter/releases/download/v1.7.0/node_exporter-1.7.0.linux-amd64.tar.gz

$ sudo tar --directory /opt --extract --verbose --file ~josevnz/Downloads/node_exporter-1.7.0.linux-amd64.tar.gz

$ rm ~/Downloads/node_exporter-1.7.0.linux-amd64.tar.gz
To make it easier to start automatically across reboots, we create a systemd unit:
$ sudo useradd --system --comment  'Prometheus account' --no-create-home --shell /sbin/nologin prometheus
$ sudo chown -R prometheus /opt/prometheus
$ sudo EDITOR=vi systemctl edit --force --full node_exporter.service
And then save the following systemd unit:
[Unit]
Description=Node exporter Server
Documentation=https://prometheus.io/docs/guides/node-exporter/
After=network-online.target

[Service]
Restart=always
User=prometheus
EnvironmentFile=/etc/default/prometheus-node-exporter
ExecStart=/opt/prometheus/node_exporter-1.7.0.linux-amd64/node_exporter $ARGS
ExecReload=/bin/kill -HUP $MAINPID
TimeoutStopSec=20s
SendSIGKILL=no

[Install]
WantedBy=multi-user.target
Now add basic settings for the exporter
$ sudo echo 'ARGS="--web.listen-address=:9100"' > /etc/default/prometheus-node-exporter
Then bring it up and make sure it is OK:
# Enable the service
$ sudo systemctl daemon-reload
$ sudo systemctl enable --now node_exporter.service
$ sudo systemctl status node_exporter.service
● node_exporter.service - Node exporter Server
Loaded: loaded (/etc/systemd/system/node_exporter.service; enabled; preset: disabled)
Active: active (running) since Sun 2023-12-03 07:43:39 EST; 6h ago
Docs: https://prometheus.io/docs/guides/node-exporter/
Main PID: 1624 (node_exporter)
Tasks: 5 (limit: 18743)
Memory: 18.0M
CPU: 44ms
CGroup: /system.slice/node_exporter.service
└─1624 /opt/prometheus/node_exporter-1.5.0.linux-amd64/node_exporter --web.listen-address=:9100
Now you can open your browser and go to the machine where node-exporter is running . For example, using curl:
$ curl --fail --silent http://dmaf5:9100/metrics # HELP go_gc_duration_seconds A summary of the pause duration of garbage collection cycles. # TYPE go_gc_duration_seconds summary go_gc_duration_seconds{quantile="0"} 3.228e-05 go_gc_duration_seconds{quantile="0.25"} 3.228e-05 go_gc_duration_seconds{quantile="0.5"} 5.1216e-05 go_gc_duration_seconds{quantile="0.75"} 5.1216e-05 go_gc_duration_seconds{quantile="1"} 5.1216e-05 go_gc_duration_seconds_sum 8.3496e-05 go_gc_duration_seconds_count 2 # HELP go_goroutines Number of goroutines that currently exist. # TYPE go_goroutines gauge go_goroutines 8 # HELP go_info Information about the Go environment. # TYPE go_info gauge go_info{version="go1.19.3"} 1
Connecting Prometheus with node-exporter
Prometheus is in charge of collecting metrics from agents on our Linux machine, like node-exporter, and other servers too!. Time to install it:
$ curl --fail --silent --location --output ~/Downloads/prometheus-2.45.1.linux-amd64.tar.gz https://github.com/prometheus/prometheus/releases/download/v2.45.1/prometheus-2.45.1.linux-amd64.tar.gz && echo OK|| echo FAIL
$ sudo tar --extract --file --verbose ~josevnz/Downloads/prometheus-2.45.1.linux-amd64.tar.gz sudo chown -R prometheus /opt/prometheus-2.45.1.linux-amd64 rm ~/Downloads/prometheus-2.45.1.linux-amd64.tar.gz
Prometheus needs details about where to scrape the data. We define settings like this:
$ sudo vi /etc/prometheus/prometheus.yaml
Here is the resulting
---
global:
    scrape_interval: 30s
    evaluation_interval: 30s
    scrape_timeout: 10s
    external_labels:
        monitor: 'nunez-family-monitor'

scrape_configs:
    - job_name: 'node-exporter'
      static_configs:
          - targets: ['dmaf5.home:9100']
I strongly recommend you validate your basic syntax using
With your favorite editor (I use vim), you can then define the following systemd unit for it:
$ sudo EDITOR=vi systemctl edit --force --full prometheus.service
Then add the following:
[Unit]
Description=Prometheus Server
Documentation=https://prometheus.io/docs/guides/
After=network-online.target

[Service]
Restart=always
User=prometheus
EnvironmentFile=/etc/default/prometheus-node-exporter
ExecStart=/opt/prometheus-2.45.1.linux-amd64/prometheus $ARGS
ExecReload=/bin/kill -HUP $MAINPID
TimeoutStopSec=20s
SendSIGKILL=no

[Install]
WantedBy=multi-user.target
Enable it and check the logs:
$ sudo systemctl daemon-reload
$ sudo systemctl enable prometheus.service --now
$ sudo systemctl status prometheus.service
● prometheus.service - Prometheus Server
     Loaded: loaded (/etc/systemd/system/prometheus.service; enabled; preset: disabled)
     Active: active (running) since Sun 2023-12-03 14:59:13 EST; 4s ago
       Docs: https://prometheus.io/docs/guides/
   Main PID: 34580 (prometheus)
      Tasks: 13 (limit: 18743)
     Memory: 15.5M
        CPU: 107ms
     CGroup: /system.slice/prometheus.service
             └─34580 /opt/prometheus-2.45.1.linux-amd64/prometheus --config.file /etc/prometheus/prometheus.yaml --storage.tsdb.path=/opt/prometheus-2.45.1.linux-amd64/data
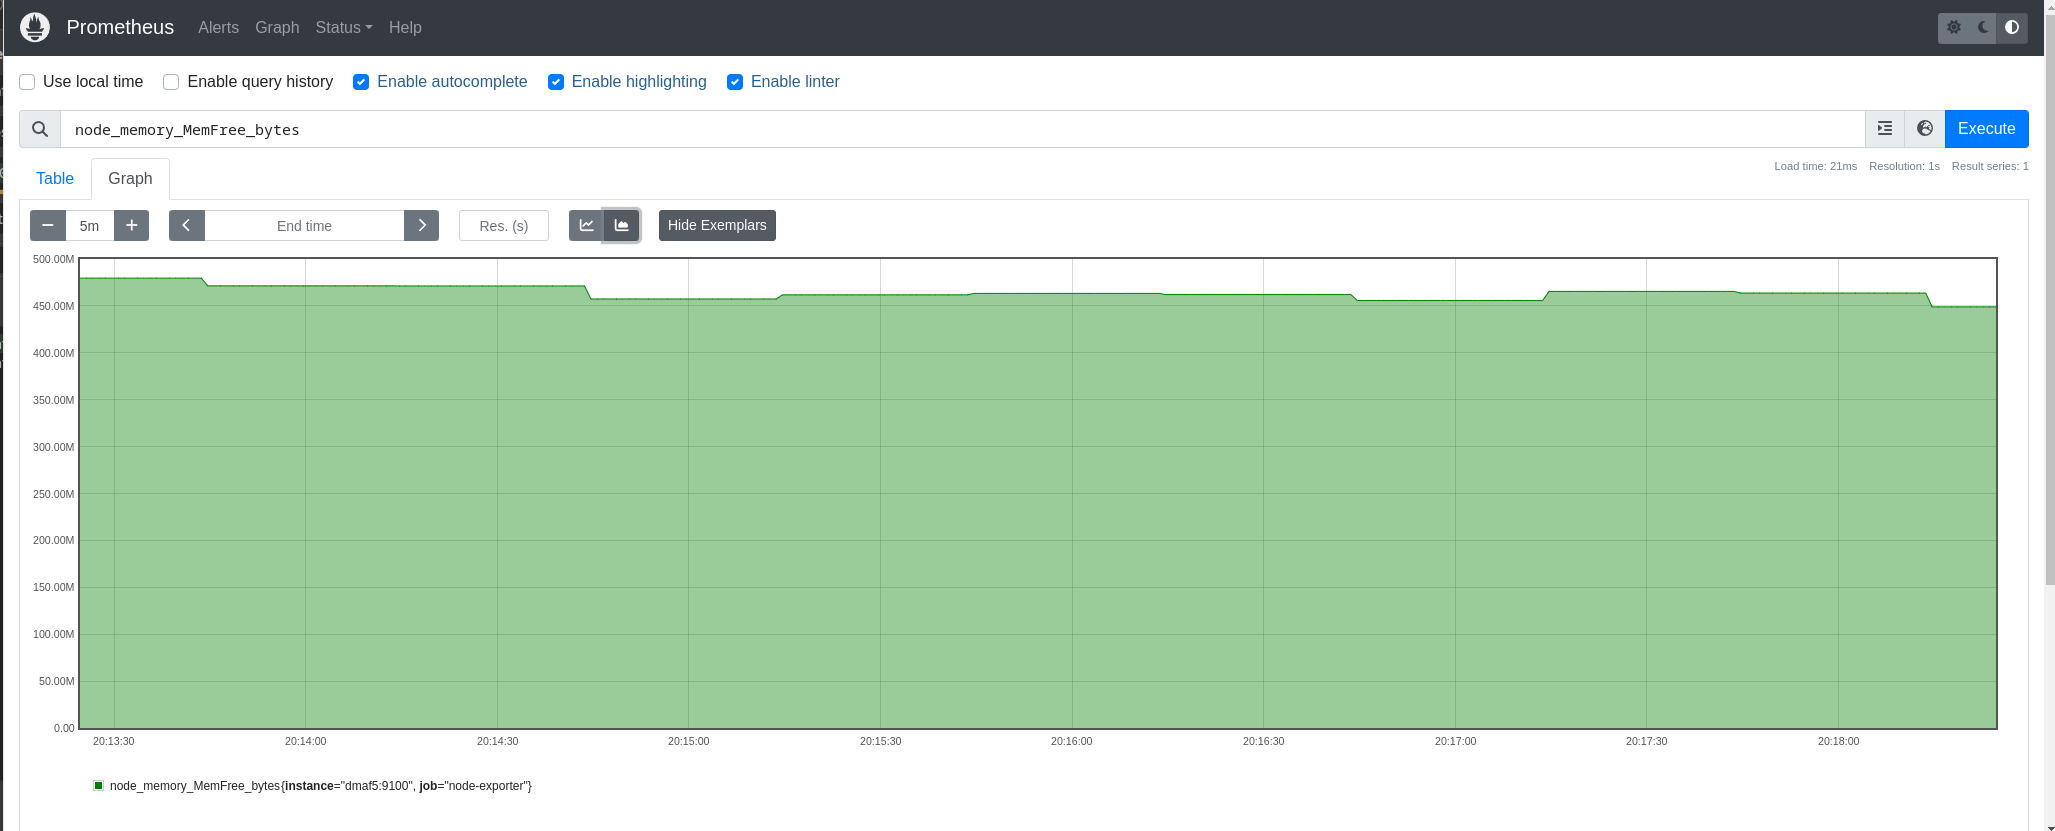
We can now check the Prometheus web interface on http://dmaf5:9090 (note that we connect to Prometheus and not node-exporter directly):
Connecting Prometheus with InfluxDB
Prometheus cannot talk directly with InfluxDB 2.xx, so we need a third component. This is called ‘Telegraf‘ and we will install it next (several commands shown from download to unpacking):
$ curl --location --fail --silent --output ~josevnz/Downloads/telegraf-1.28.5_linux_amd64.tar.gz  https://dl.influxdata.com/telegraf/releases/telegraf-1.28.5_linux_amd64.tar.gz

$ sudo tar --extract --verbose --directory /opt --file ~josevnz/Downloads/telegraf-1.28.5_linux_amd64.tar.gz

$ sudo useradd --system --comment  'Telegraf account' --no-create-home --shell /sbin/nologin telegraf

$ sudo mkdir -p /etc/telegraf/

$ sudo touch /etc/default/telegraf /etc/telegraf/telegraf.conf

$ sudo chown -R telegraf /opt/telegraf-1.28.5 /etc/telegraf /etc/default/telegraf

$ curl --location --fail --silent --output ~josevnz/Downloads/telegraf-1.28.5_linux_amd64.tar.gz https://dl.influxdata.com/telegraf/releases/telegraf-1.28.5_linux_amd64.tar.gz
$ sudo tar --extract --verbose --directory /opt --file ~josevnz/Downloads/telegraf-1.28.5_linux_amd64.tar.gz
$ sudo useradd --system --comment 'Telegraf account' --no-create-home --shell /sbin/nologin telegraf
$ sudo mkdir -p /etc/telegraf/
# Empty telegraf.conf, we will put proper contents there soon
$ sudo touch /etc/default/telegraf /etc/telegraf/telegraf.conf
$ sudo chown -R telegraf /opt/telegraf-1.28.5 /etc/telegraf /etc/default/telegraf
I borrowed the systemd unit from Telegraf, and made some changes to it:
$ sudo EDITOR=vi systemctl edit --full --force telegraf.service
The resulting systemd unit:
[Unit]
Description=Telegraf
Documentation=https://github.com/influxdata/telegraf
After=network-online.target
Wants=network-online.target

[Service]
Type=notify
EnvironmentFile=-/etc/default/telegraf
User=telegraf
ImportCredential=telegraf.*
ExecStart=/opt/telegraf-1.28.5/usr/bin/telegraf -config /etc/telegraf/telegraf.conf -config-directory /etc/telegraf/telegraf.d $TELEGRAF_OPTS
ExecReload=/bin/kill -HUP $MAINPID
Restart=on-failure
RestartForceExitStatus=SIGPIPE
KillMode=mixed
TimeoutStopSec=5
LimitMEMLOCK=8M:8M
PrivateMounts=true

[Install]
WantedBy=multi-user.target
Telegraf can scrape data directly from Node exporter without talking to Prometheus , and then it can relay it back to InfluxDB. Telegraf is the glue that will allow us to connect together both services.
We need to store the data into a bucket and also an authentication token is required. Both can be created on the command line as follows (using the InfluxDB docker container):
josevnz@raspberrypi:~$ podman exec --tty --interactive influxdb_raspberrypi /bin/bash
root@raspberrypi:/#
# Create a bucket called 'prometheus'
root@raspberrypi:/# influx bucket create --org Kodegeek --name prometheus  --description 'Prometheus storage' --retention 0
ID			Name		Retention	Shard group duration	Organization ID		Schema Type
5efea066b05e584d	prometheus	infinite	168h0m0s		c334619ae2cd7b3d	implicit
# Now create an authentication token for the new bucket, id = 5efea066b05e584d

root@raspberrypi:/# influx auth create --org Kodegeek --description 'Authorization for Prometheus' --write-bucket 5efea066b05e584d --read-bucket 5efea066b05e584d --write-buckets --read-buckets
ID			Description			Token												User Name	User ID			Permissions
0c49edb275400000	Authorization for Prometheus	bo1-N1Ythhpxj0oAh14TDfEM66Ty0Iz7bmLkxEcUdune3pSj8Or7Lzoe-PCWr-yqyabxBukOIurjdTnSCSsUFw==	josevnz		09ff917433270000	[read:orgs/c334619ae2cd7b3d/buckets/5efea066b05e584d write:orgs/c334619ae2cd7b3d/buckets/5efea066b05e584d read:orgs/c334619ae2cd7b3d/buckets write:orgs/c334619ae2cd7b3d/buckets]
Time to connect Telegraf with the InfluxDB instance. This requires changes on
## Collect Node-exporter Prometheus formatted metrics on dmaf5. In this case node-exporter service
## http://dmaf5:9100/metrics (Node exporter) != http://dmaf5:9090/metrics Prometheus scrapper
[[inputs.prometheus]]
  urls = ["http://dmaf5:9100/metrics"]
  metric_version = 2

## Write Prometheus formatted metrics to InfluxDB prometheus bucket
[[outputs.influxdb_v2]]
  urls = ["http://raspberrypi:8086"]
  token = "bo1-N1Ythhpxj0oAh14TDfEM66Ty0Iz7bmLkxEcUdune3pSj8Or7Lzoe-PCWr-yqyabxBukOIurjdTnSCSsUFw=="
  organization = "Kodegeek"
  bucket = "prometheus"
Now connect our Prometheus installation with Telegraf and enable the service on dmaf5, where Telegraf was installed:
$ sudo systemctl daemon-reload systemctl enable telegraf.service --now
Confirm that it is running:
$ sudo systemctl enable telegraf.service --now
$ sudo systemctl status telegraf.service
● telegraf.service - Telegraf
     Loaded: loaded (/etc/systemd/system/telegraf.service; enabled; preset: disabled)
     Active: active (running) since Sun 2023-12-17 07:28:07 EST; 7s ago
       Docs: https://github.com/influxdata/telegraf
   Main PID: 9290 (telegraf)
      Tasks: 13 (limit: 18743)
     Memory: 217.6M
        CPU: 303ms
     CGroup: /system.slice/telegraf.service
             ├─9290 /opt/telegraf-1.28.5/usr/bin/telegraf -config /etc/telegraf/telegraf.conf -config-directory /etc/telegraf/telegraf.d
             └─9305 /usr/bin/dbus-daemon --syslog --fork --print-pid 4 --print-address 6 --session

Dec 17 07:28:07 dmaf5 telegraf[9290]: 2023-12-17T12:28:07Z I! Available plugins: 240 inputs, 9 aggregators, 29 processors, 24 parsers, 59 outputs, 5 secret-stores
Dec 17 07:28:07 dmaf5 telegraf[9290]: 2023-12-17T12:28:07Z I! Loaded inputs: prometheus
Dec 17 07:28:07 dmaf5 telegraf[9290]: 2023-12-17T12:28:07Z I! Loaded aggregators:
Dec 17 07:28:07 dmaf5 telegraf[9290]: 2023-12-17T12:28:07Z I! Loaded processors:
Dec 17 07:28:07 dmaf5 telegraf[9290]: 2023-12-17T12:28:07Z I! Loaded secretstores:
Dec 17 07:28:07 dmaf5 telegraf[9290]: 2023-12-17T12:28:07Z I! Loaded outputs: influxdb_v2
Dec 17 07:28:07 dmaf5 telegraf[9290]: 2023-12-17T12:28:07Z I! Tags enabled: host=dmaf5
Dec 17 07:28:07 dmaf5 telegraf[9290]: 2023-12-17T12:28:07Z I! [agent] Config: Interval:10s, Quiet:false, Hostname:"dmaf5", Flush Interval:10s
Dec 17 07:28:07 dmaf5 telegraf[9290]: 2023-12-17T12:28:07Z I! [inputs.prometheus] Using the label selector:  and field selector:
Dec 17 07:28:07 dmaf5 systemd[1]: Started telegraf.service - Telegraf.
Now we can use the Data Explorer panel to check on the InfluxDB GUI see some of the captured metrics. For example, number of bytes read from my NVME drives:
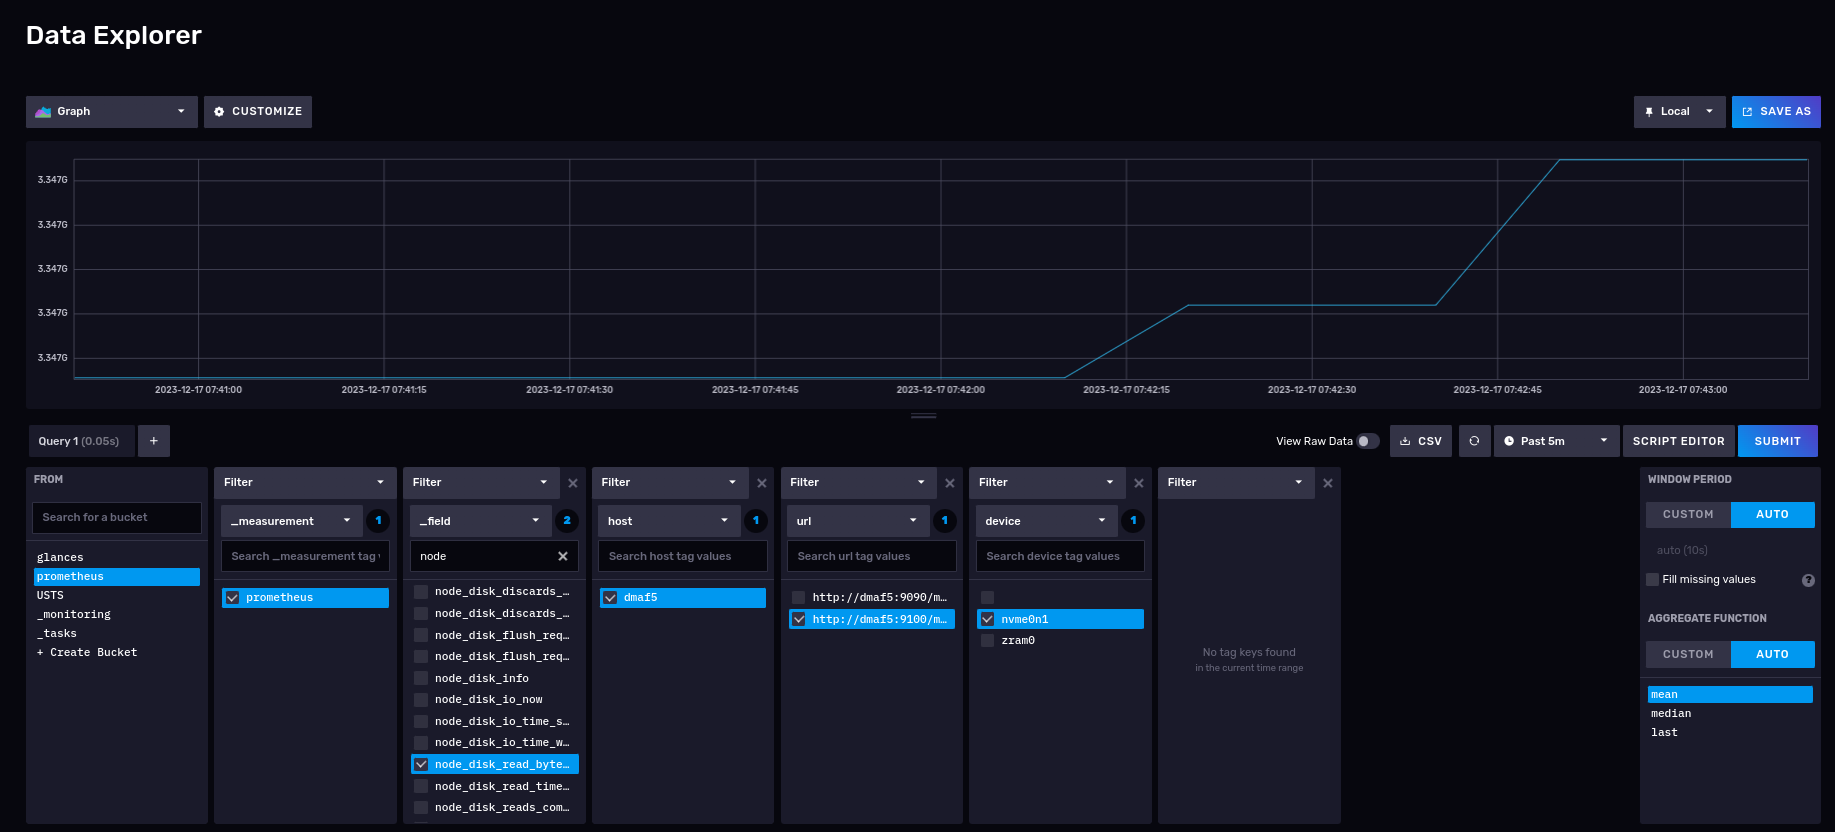
As you can see we can now skip using the Prometheus scrapper with no changes to your existing Prometheus configuration. Instead we let Telegraf collect the data for us directly into the InfluxDB database.
But, are these the only integration possible with InfluxDB?
Integration with Glances
Glances is another great monitoring tool, written in Python, and it is a great alternative to Prometheus for the following scenarios:
- Cannot deploy a node exporter agent because you lack the privileges, or have a company policy you must follow (like another agent running)
- Want to get insight on the host performance but for limited time and don’t want to deal with a formal deployment. Run it for a while, then shut it down.
- You already use Glances for monitoring and want to persist this information for later analysis.
Next we will show you how you can integrate both tools.
A quick demonstration of Glances
Installation is pretty simple with pip:
$ python -m venv ~/virtualenv/glances
$ . ~/virtualenv/glances/bin/activate (glances)
$ pip install --upgrade glances
... Successfully installed glances-3.4.0.3
Normally you call glances without any options, to capture stats:
# Running in standalone mode (glances)
$ glances
If we want to record activity from Glances, we need to set up a InfluxDB so it can accept our activity data.
Creating a Glances bucket to store our activity data
First step is to connect to our InfluxDB instance and create a bucket, I called mine
Most likely you already have several buckets in your InfluxDB database so we will create a new bucket.
Now inside the influxdb_raspberrypi running container we create a bucket with a retention policy to keep our data forever:
josevnz@raspberrypi:~$ podman exec --tty --interactive influxdb_raspberrypi /bin/bash

root@raspberrypi:/# influx bucket create --org Kodegeek --name glances --description 'Glances storage' --retention 0

ID Name Retention Shard group duration Organization ID Schema Type 305430cf2f5de6fd glances infinite 168h0m0s c334619ae2cd7b3d implicit
Our bucket has the id ‘305430cf2f5de6fd’. We will use that to create an authorization token we can use to insert/ read data remotely from Glances:
josevnz@raspberrypi:~$ podman exec --tty --interactive influxdb_raspberrypi /bin/bash
root@raspberrypi:/# influx auth create --org Kodegeek --description 'Authorization for Glances' --write-bucket 305430cf2f5de6fd --read-bucket 305430cf2f5de6fd --write-buckets --read-buckets
ID Description Token User Name User ID Permissions 0c37feccff400000 Authorization for Glances UnmEgl1HQ7AiZB8_QrCJFYkm2tE_e82_Sd9jnkrMsj1nA0YONpazx2HHuoPK3b_GnP7WX2qNURDnUfvcQyfagw== josevnz 09ff917433270000 [read:orgs/c334619ae2cd7b3d/buckets/305430cf2f5de6fd write:orgs/c334619ae2cd7b3d/buckets/305430cf2f5de6fd read:orgs/c334619ae2cd7b3d/buckets write:orgs/c334619ae2cd7b3d/buckets]
Here we get the authorization token
'UnmEgl1HQ7AiZB8_QrCJFYkm2tE_e82_Sd9jnkrMsj1nA0YONpazx2HHuoPK3b_GnP7WX2qNURDnUfvcQyfagw=='.
We will use it in our Glances configuration file:
Now we need to bridge glances with InfluxDB. For that we can add the following to the Glances configuration file:
$ mkdir ~/.config/glances/
/bin/cat<<GLANCES>~/.config/glances/glances.conf
[global]
refresh=2
check_update=false
history_size=28800
[influxdb2]
# server2 is where InfluxDB is running
host=raspberrypi
port=8086
protocol=http
org=KodeGeek
bucket=glances
# And here you put the token we generated on the previous step
token=UnmEgl1HQ7AiZB8_QrCJFYkm2tE_e82_Sd9jnkrMsj1nA0YONpazx2HHuoPK3b_GnP7WX2qNURDnUfvcQyfagw==
GLANCES
Next install the InfluxDB Python client. This allows Glances to export the metrics directly to InfluxDB:
$ pip install --upgrade influxdb-client
Requirement already satisfied: influxdb-client in /home/josevnz/virtualenv/glances/lib64/python3.11/site-packages (1.36.1)
Collecting influxdb-client
Downloading influxdb_client-1.38.0-py3-none-any.whl (743 kB)
━━━━━━━━━━━━━━━━━━━━━━━━━━━━━━━━━━━━━━━━ 743.5/743.5 kB 8.1 MB/s eta 0:00:00
Requirement already satisfied: reactivex>=4.0.4 in /home/josevnz/virtualenv/glances/lib64/python3.11/site-packages (from influxdb-client) (4.0.4)
Requirement already satisfied: certifi>=14.05.14 in /home/josevnz/virtualenv/glances/lib64/python3.11/site-packages (from influxdb-client) (2022.12.7)
Requirement already satisfied: python-dateutil>=2.5.3 in /home/josevnz/virtualenv/glances/lib64/python3.11/site-packages (from influxdb-client) (2.8.2)
Requirement already satisfied: setuptools>=21.0.0 in /home/josevnz/virtualenv/glances/lib64/python3.11/site-packages (from influxdb-client) (67.6.0)
Requirement already satisfied: urllib3>=1.26.0 in /home/josevnz/virtualenv/glances/lib64/python3.11/site-packages (from influxdb-client) (1.26.15)
Requirement already satisfied: six>=1.5 in /home/josevnz/virtualenv/glances/lib64/python3.11/site-packages (from python-dateutil>=2.5.3->influxdb-client) (1.16.0)
Requirement already satisfied: typing-extensions<5.0.0,>=4.1.1 in /home/josevnz/virtualenv/glances/lib64/python3.11/site-packages (from reactivex>=4.0.4->influxdb-client) (4.5.0)
Installing collected packages: influxdb-client
Attempting uninstall: influxdb-client
Found existing installation: influxdb-client 1.36.1
Uninstalling influxdb-client-1.36.1:
Successfully uninstalled influxdb-client-1.36.1
Successfully installed influxdb-client-1.38.0
Now we just need to run Glances again:
$ . ~/virtualenv/glances/bin/activate
# Refresh every 5 seconds, export to influxdb2
glances --time 5 --export influxdb2
Make sure that you have set up your authorization configuration properly. On the InfluxDB container you should now see these:
$ podman logs --follow influxdb_raspberrypi

2023-12-03T13:10:49.944038Z info Unauthorized {"log_id": "0lVhMguW000", "error": "authorization not found"} 2023-12-03T13:11:33.357711Z info Unauthorized {"log_id": "0lVhMguW000", "error": "token required"
Optionally you could run tshark and confirm that Glances is making POST requests to the InfluxDB endpoint:
$ tshark -i eno1 -Y http.request -f "host 192.168.68.60 and tcp port 8086"
Capturing on 'eno1'
 ** (tshark:18229) 09:58:47.993686 [Main MESSAGE] -- Capture started.
 ** (tshark:18229) 09:58:47.994375 [Main MESSAGE] -- File: "/var/tmp/wireshark_eno19kN1jG.pcapng"
   11 2.690111928 192.168.68.73 → 192.168.68.60 HTTP 881 POST /api/v2/write?org=Kodegeek&bucket=glances&precision=ns HTTP/1.1  (text/plain)
   24 3.824977400 192.168.68.73 → 192.168.68.60 HTTP 891 POST /api/v2/write?org=Kodegeek&bucket=glances&precision=ns HTTP/1.1  (text/plain)
   37 4.128239147 192.168.68.73 → 192.168.68.60 HTTP 901 POST /api/v2/write?org=Kodegeek&bucket=glances&precision=ns HTTP/1.1  (text/plain)
   51 5.872746588 192.168.68.73 → 192.168.68.60 HTTP 907 POST /api/v2/write?org=Kodegeek&bucket=glances&precision=ns HTTP/1.1  (text/plain)
   71 6.120250641 192.168.68.73 → 192.168.68.60 HTTP 868 POST /api/v2/write?org=Kodegeek&bucket=glances&precision=ns HTTP/1.1  (text/plain)
   91 6.503915790 192.168.68.73 → 192.168.68.60 HTTP 870 POST /api/v2/write?org=Kodegeek&bucket=glances&precision=ns HTTP/1.1  (text/plain)
  104 7.838737858 192.168.68.73 → 192.168.68.60 HTTP 883 POST /api/v2/write?org=Kodegeek&bucket=glances&precision=ns HTTP/1.1  (text/plain)
  117 8.576475158 192.168.68.73 → 192.168.68.60 HTTP 884 POST /api/v2/write?org=Kodegeek&bucket=glances&precision=ns HTTP/1.1  (text/plain)
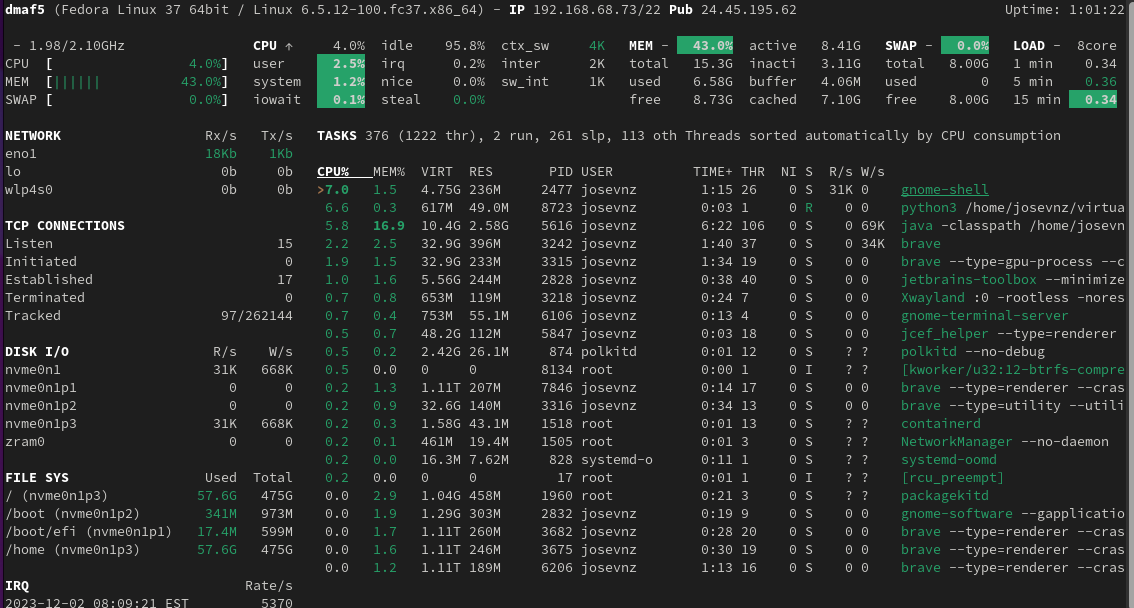
At ‘glance’ not much is happening (pun intended) but if we go to the InfluxDB data explorer we will see a new bucket there, along with a few collections:

This particular time series shows memory utilization over time, where Glances is running. Glances, by default, collects many interesting metrics out of the box.
What did we learn
- If you are still curious about the Prometheus and InfluxDB overlapping functionalities, you should read this comparison.
- I showed you how to use tshark for troubleshooting. This tool is a must in your bag of tricks.
- There are RPMs available for Fedora to install node-exporter, Prometheus, and Telegraf. Feel free to try them. I wanted extra flexibility for my installation, so I decided to perform most of the installation steps manually.
- Glances and Prometheus are not the only possible integrations with InfluxDB. Many more are supported thanks to the Telegraf plugins.
- Source code for the Glances and InfluxDB integration can be downloaded from here, with examples.

crd
Typo in first
command:
->
Richard England
Fixed, thank you.
Todd Lewis
With so much good stuff here that deserves comment, I feel a little bad starting with this one, but here goes. It looks like you’re pulling in amd64 binaries… to a Raspberry Pi!? I’m sure I’m missing something really basic. Could you describe the greater environment this runs in? Some more context would be helpful. Thanks.
Jose Vicente Ninez
Hello,
You have a point, my environment is the following:
1) InfluxDB running on a RaspberryPI4, Ubuntu
2) 2 regular Linux AMD servers, Fedora
I tough about putting a diagram to explain better but felt the article was already too long. Probably will amend my version of the article on GitHub.
Also, I can guarantee all the servers were running properly and binaries downloaded matched their architecture 🙂
Mathew Robinson
The one thing I’m not clear on is why I would choose to use InfluxDB over base Prometheus? I read the comparison linked to from here and it just seems like extra steps.
InfluxDB seems more like if I want to write software that uses a time series database for like event sourcing than it is a monitoring tool. Have I missed something?
Thanks for the detailed writeup!
Jose Nunez
Hello Mathew,
You don’t need to replace Prometheus (it is very good at what it does), as I explained in the article you can let Telegraf scrape Prometheus aware agents like node-exporter.
So why bother having yet another database? There are a few scenarios:
1) You already have built-in monitoring logic with your custom app, using an InfluxDB database and you want to centralize those queries, using a SQL like language (InfluxQL or Flux)
2) You cannot use Prometheus as the storage solution but still want your applications to export metrics (https://prometheus.io/docs/instrumenting/exporters/)
I prefer to have more options and I found in practice both Prometheus and InfluxDB complement each other nicely.
mx
Sorry, I don’t quite understand why InfluxDB and Prometheus need to be linked, it has its own built-in database.
I have many exporters that submit data to Prometheus and then Grafana takes it from there.
I also have old servers with nagios and it puts metrics into InfluxDB and then Grafana uses them.
But I don’t understand why Prometheus should put metrics into InfluxDB ….
Jose Nunez
MX (?),
You don’t need to run Prometheus, Telegraf takes over and asks node-exporter for the data and relays it all the way to InfluxDB. Prometheus doesn’t put any metrics on InfluxDB, is Telegraf.
I showed the integration for readers familiar with the typical Prometheus -> Node-exporter integration to make the setup easier to understand.
There are some scenarios where you cannot run Prometheus and still want to take advantage of really good clients like node-exporter.
Hope this helps.
mx
Thanks for the reply, yes I understand your point.
Although the use of the same Glances is somewhat questionable, because of Python, why increase the load …
For me Prometheus is first of all AlertManager and Karma and after that you can analyze graphs, why look at them just like that?
Well that’s not really relevant, Thanks for your article.
Tim
Typo installing glances:
pip install –upgrade glance
Not the same thing
Gregory Bartholomew
Fixed. Thanks.
Clifford Woodrow Crawford
This is a good flex💪 of what can be done! Thanks!
Jose Nunez
Glad that you liked it. For me one of the favorites is the Glances + InfluxDB, it has been a time saver several times for me.
Rafal
Nice article. Good for readers who want to see something complex. But it is simpler to use just influxdb as database and telegraf inputs to collect metrics directly from operating system and deliver them to output influxdb.
Jose Nunez
Hello Rafal,
That’s exactly what is done at the end of the tutorial. But I tough it was important to show other tools out there, like the very capable Prometheus. Also, there are times when you cannot install telegraf and a tool like Glances can fill the gap.
Clemens Eisserer
I initially based my home-monitoring system on InfluxDB, because it seemed the way to go. Soon I had to find out, that I am left on 1.x because 2.x is limited to 64-bit. I upgraded my Pi to a 64-bit OS image just to find out Influxdb 1.x and 2.x are not compatible.
Deleted all that InfluxDB stuff, installed PostgreSQL again, migrated data and I don’t miss a thing (thanks to BRIN indices).
Jose Nunez
InfluxDB has documentation about how to migrate from versions. I’m not sure what was your issue so I assume it was not the data migration but features that changes.
I particularly like solutions like Prometheus or InfluxDB as they are schema-less. In PostgreSQL you have to create a table. If the schema changes, you have do to an alter table.
I’m not familiar with the BRIN indices but I assume they help to store the time series data efficiently, like Prometheus or InfluxDB.
For time series I think these solutions that work out of the box as a time saver, specially when you are troubleshooting an issue and need to capture data as quickly and completely as possible.
Maybe you should write an article about monitoring systems with PostgreSQL, people will benefit a lot from it.
crd
Typo: ‘promethus’ -> ‘prometheus’ in the yamllint suggestion.
Richard England
Corrected. Thank you for pointing this out.