


In this article, we introduce below: an Apache 2.0 licensed resource monitor for modern Linux systems. below allows you to replay previously recorded data.
Background
One of the kernel’s primary responsibilities is mediating access to resources. Sometimes this might mean parceling out physical memory such that multiple processes can share the same host. Other times it might mean ensuring equitable distribution of CPU time. In all these contexts, the kernel provides the mechanism and leaves the policy to “someone else”. In more recent times, this “someone else” is usually a runtime like systemd or dockerd. The runtime takes input from a scheduler or end user — something along the lines of what to run and how to run it — and turns the right knobs and pulls the right levers on the kernel such that the workload can —well — get to work.
In a perfect world this would be the end of the story. However, the reality is that resource management is a complex and rather opaque amalgam of technologies that has evolved over decades of computing. Despite some of this technology having various warts and dead ends, the end result — a container — works relatively well. While the user does not usually need to concern themselves with the details, it is crucial for infrastructure operators to have visibility into their stack. Visibility and debuggability are essential for detecting and investigating misconfigurations, bugs, and systemic issues.
To make matters more complicated, resource outages are often difficult to reproduce. It is not unusual to spend weeks waiting for an issue to reoccur so that the root cause can be investigated. Scale further compounds this issue: one cannot run a custom script on every host in the hopes of logging bits of crucial state if the bug happens again. Therefore, more sophisticated tooling is required. Enter below.
Motivation
Historically Facebook has been a heavy user of atop [0]. atop is a performance monitor for Linux that is capable of reporting the activity of all processes as well as various pieces of system level activity. One of the most compelling features atop has over tools like htop is the ability to record historical data as a daemon. This sounds like a simple feature, but in practice this has enabled debugging countless production issues. With long enough data retention, it is possible to go backwards in time and look at the host state before, during, and after the issue or outage.
Unfortunately, it became clear over the years that atop had certain deficiencies. First, cgroups [1] have emerged as the defacto way to control and monitor resources on a Linux machine. atop still lacks support for this fundamental building block. Second, atop stores data on disk with custom delta compression. This works fine under normal circumstances, but under heavy resource pressure the host is likely to lose data points. Since delta compression is in use, huge swaths of data can be lost for periods of time where the data is most important. Third, the user experience has a steep learning curve. We frequently heard from atop power users that they love the dense layout and numerous keybindings. However, this is a double edged sword. When someone new to the space wants to debug a production issue, they’re solving two problems at once now: the issue at hand and how to use atop.
below was designed and developed by and for the resource control team at Facebook with input from production atop users. The resource control team is responsible for, as the name suggests, resource management at scale. The team is comprised of kernel developers, container runtime developers, and hardware folks. Recognizing the opportunity for a next-generation system monitor, we designed below with the following in mind:
- Ease of use: below must be both intuitive for new users as well as powerful for daily users
- Opinionated statistics: below displays accurate and useful statistics. We try to avoid collecting and dumping stats just because we can.
- Flexibility: when the default settings are not enough, we allow the user to customize their experience. Examples include configurable keybindings, configurable default view, and a scripting interface (the default being a terminal user interface).
Install
To install the package:
# dnf install -y below
To turn on the recording daemon:
# systemctl enable --now below
Quick tour
below’s most commonly used mode is replay mode. As the name implies, replay mode replays previously recorded data. Assuming you’ve already started the recording daemon, start a session by running:
$ below replay --time "5 minutes ago"
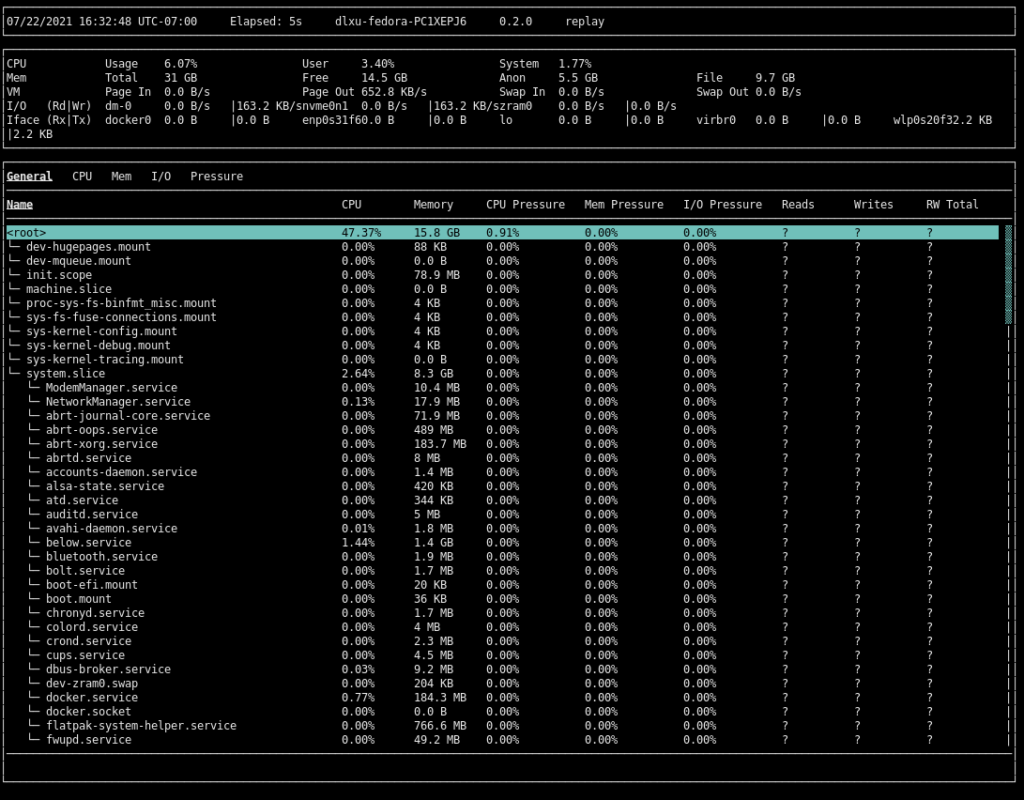
You will then see the cgroup view:
If you get stuck or forget a keybinding, press ? to access the help menu.
The very top of the screen is the status bar. The status bar displays information about the current sample. You can move forwards and backwards through samples by pressing t and T, respectively. The middle section is the system overview. The system overview contains statistics about the system as a whole that are generally always useful to see. The third and lowest section is the multipurpose view. The image above shows the cgroup view. Additionally, there are process and system views, accessible by pressing p and s, respectively.
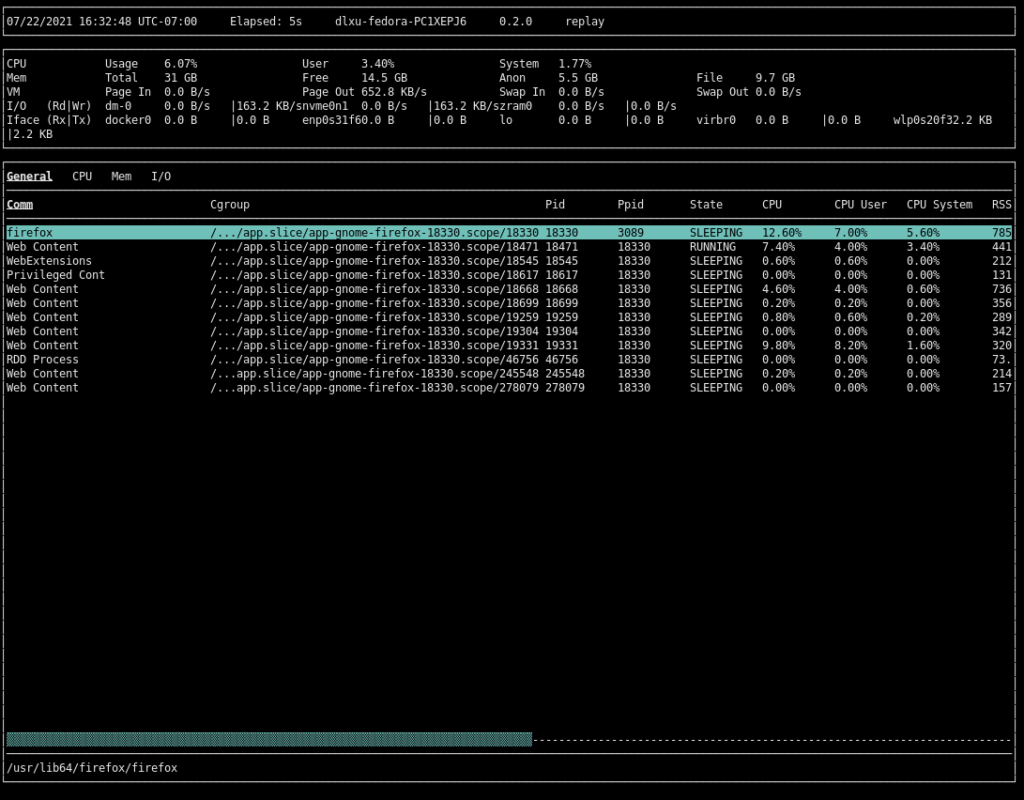
Press ↑ and ↓ to move the list selection. Press <Enter> to collapse and expand cgroups. Suppose you’ve found an interesting cgroup and you want to see what processes are running inside it. To zoom into the process view, select the cgroup and press z:
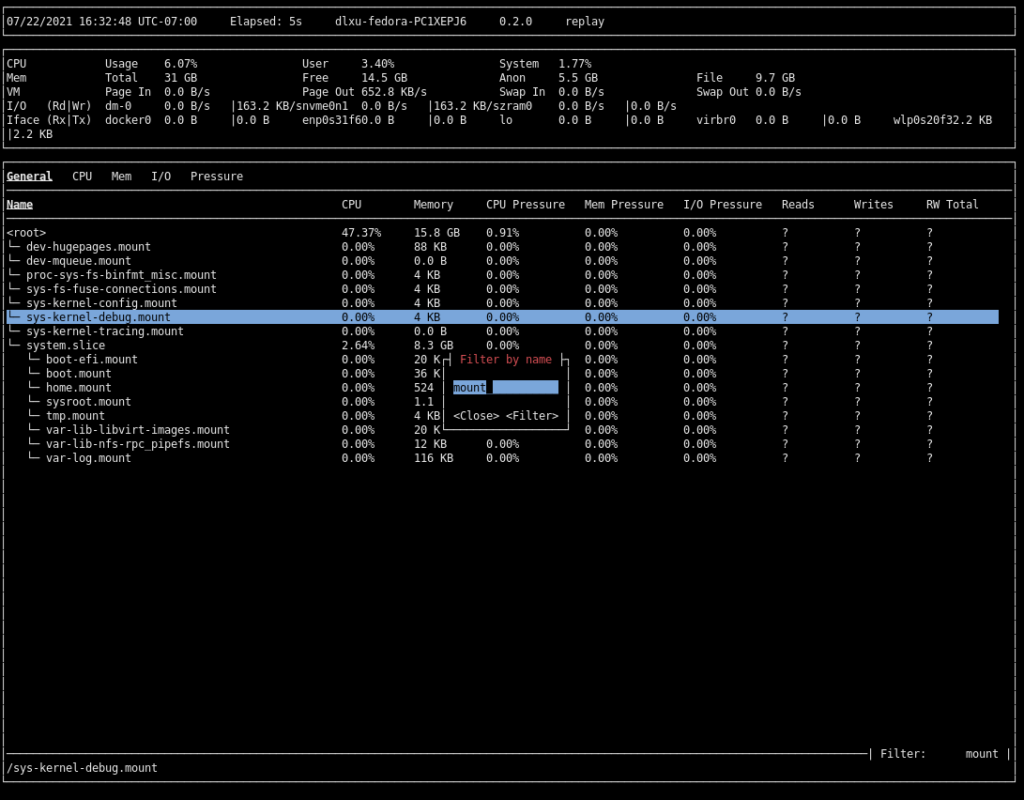
Press z again to return to the cgroup view. The cgroup view can be somewhat long at times. If you have a vague idea of what you’re looking for, you can filter by cgroup name by pressing / and entering a filter:
At this point, you may have noticed a tab system we haven’t explored yet. To cycle forwards and backwards through tabs, press <Tab> and <Shift> + <Tab> respectively. We’ll leave this as an exercise to the reader.
Other features
Under the hood, below has a powerful design and architecture. Facebook is constantly upgrading to newer kernels, so we never assume a data source is available. This tacit assumption enables total backwards and forwards compatibility between kernels and below versions. Furthermore, each data point is zstd compressed and stored in full. This solves the issues with delta compression we’ve seen atop have at scale. Based on our tests, our per-sample compression can achieve on average a 5x compression ratio.
below also uses eBPF [2] to collect information about short-lived processes (processes that live for shorter than the data collection interval). In contrast, atop implements this feature with BSD process accounting, a known slow and priority-inversion-prone kernel interface.
For the user, below also supports live-mode and a dump interface. Live mode combines the recording daemon and the TUI session into one process. This is convenient for browsing system state without committing to a long running daemon or disk space for data storage. The dump interface is a scriptable interface to all the data below stores. Dump is both powerful and flexible — detailed data is available in CSV, JSON, and human readable format.
Conclusion
below is an Apache 2.0 licensed open source project that we (the below developers) think offers compelling advantages over existing tools in the resource monitoring space. We’ve spent a great deal of effort preparing below for open source use so we hope that readers and the community get a chance to try below out and report back with bugs and feature requests.
[0]: https://www.atoptool.nl/
[1]: https://en.wikipedia.org/wiki/Cgroups
[2]: https://ebpf.io/

Timothée Ravier
Link to the project: https://github.com/facebookincubator/below
Nathan Scott
Interesting stuff – it’s a fascinating area. ‘below’ sounds like a project that is just starting to tackle some of the hard problems that have been solved by the Performance Co-Pilot toolkit too. PCP has been in use and solving production problems for over 20 years – it’d be interesting to read a comparison to PCP instead of atop.
https://pcp.io/
https://pcp.readthedocs.io/
https://github.com/performancecopilot/pcp/
Let me know if I can help with that? Also happy to discuss design choices made in PCP over the years that may be of assistance as you start to develop ‘below’ – shoot me an email if interested.
cheers!
Daniel Xu
Hey Nathan,
I haven’t looked very closely at PCP before, but based on what I learned in the last 20 minutes, PCP looks quite powerful and has a lot of front-end options. I’d say the main distinction w/ below is that below is more opinionated and targeted towards troubleshooting resource issues.
One thing that could be interesting is using below’s front-end w/ PCP’s backend. below’s code is structured to support different backends already (used internally for our remote view capability).
Nathan Scott
Hi Daniel,
Great idea – it sounds like the code is quite similarly structured to https://htop.dev where we’ve recently merged the first version of a PCP backend in similar fashion:
https://github.com/htop-dev/htop/pull/536
We then also introduced the ability to extend the UI with any metric, which may be an interesting possibility for ‘below’ to look into as well:
https://github.com/htop-dev/htop/pull/669
https://github.com/htop-dev/htop/pull/707
I’ll send you an email to continue the discussion and explore these ideas further.
Ben
Hi,
Thanks for the informative article. However, it seems (for me) that it’s not yet available (I’m on Fedora 33, can’t upgrade yet).
Dnf is unable to find it (either via search or install), seems it’s only available as an rpm for F34
However, “cargo install below” works perfectly (for me)
Thanks,
Ben
Anthropy
If you enjoy performance monitoring especially on production systems, you could also look at things like Netdata (simple webgui, basically zero config) or things like Prometheus (can work together with netdata) or Sensu or Nagios or Zabbix, to get an insight into historical usage of basically every resource, also for entire clusters and such. It’ll also allow you to set up alerting based on resource usage so you can act before it crashes instead of debugging it after the fact.
And it may sound overkill, but Netdata is really lightweight and can also be used over SSH tunnels and such, so there’s no need to set up extra ports or anything like that, and it does so much more than stuff like atop/below from my experience.
Not to say atop/below and other tools like PCP (which also works with Cockpit btw, if you prefer that web gui instead) don’t have their value, everyone has their own preferences, but for production systems and larger scale deployments, stuff like netdata + prometheus or something else like that can be really beneficial so I thought I’d mention it at least.